Check the health and availability of your Linux servers for optimal performance with Site24x7's Linux monitoring tool.
How to Troubleshoot Network with Ping, Traceroute and Netstat
When deploying and troubleshooting software in production servers, system administrators often encounter network issues–such as a connection loss, blocked server ports, or the destination address blocking an external connection.
Troubleshooting network issues is a challenging and time-consuming task—especially if we lack the proper tools and experience. Fortunately, there are a number of tools available, most notably a combination also known as the trifecta of network troubleshooting: ping, traceroute, and netstat.
The ping command
ping is one of the most popular command line tools used both by IT professionals and users. Ping is used to verify that the local machine has an internet connection without launching a web browser.
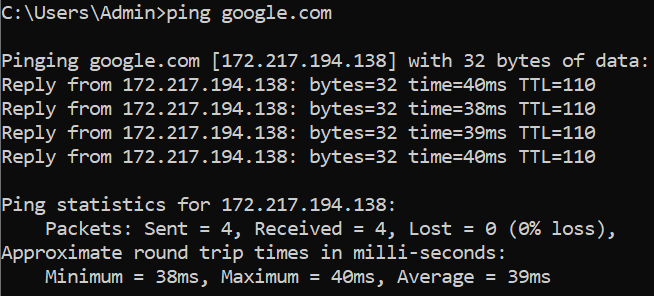 Fig. 1: A popular way to test internet connection in a command line tool
In a different scenario, to find out whether the problem relies on the application or the server,
technicians can use ping to check if the server's IP address is reachable or not.
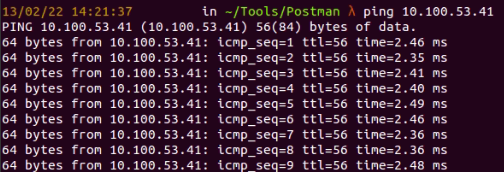 Fig. 2 : A
 ping example command
In figure 2, the server is still accessible through the ping command, which means we need to
further investigate why the web application is inaccessible.
ping comes with a number of parameters to support the network debugging process. For more ping options, run ping –help.
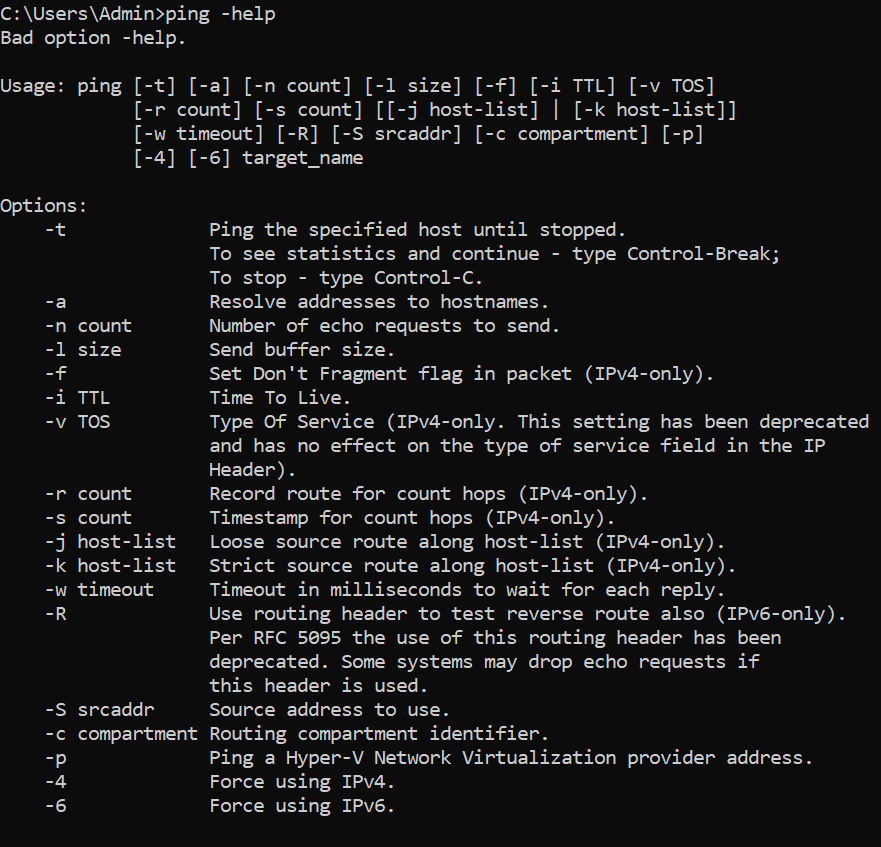 Fig. 3:
 ping options displayed in a command line interface
We can also add a timestamp before each line in the ping output.
ping -D zoho.com
 Fig. 4: Running
 ping -d on a Linux machine
Note that ping options may vary between Linux and Windows operating systems, so you will first need to check for the available options.
Using traceroute
traceroute is used to identify the path from starting point to destination. Traceroute is a more powerful tool that can help uncover problems that ping cannot. Here’s an example for the traceroute command with Zoho.com:
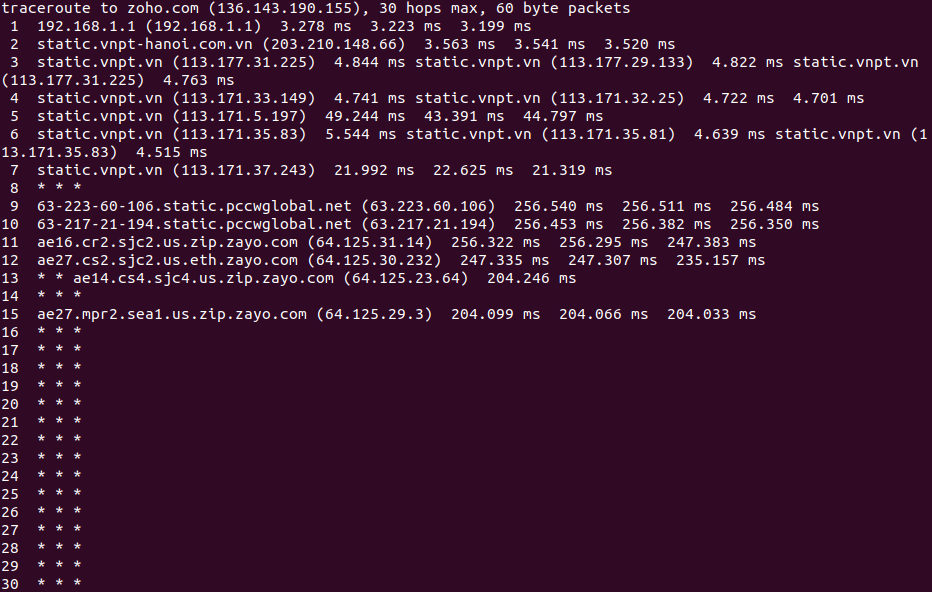 Fig. 5 : A
 traceroute check for Zoho.com
traceroute to Zoho.com (136.143.190.155), 30 hops max, 60 byte packets
This tells us that there is a maximum number of 30 hops from the client to the Zoho.com server.
11  ae16.cr2.sjc2.us.zip.zayo.com (64.125.31.14)
256.322ms  256.295 ms  247.383 ms
The first column shows the number of the hop (11), while the second column displays the hop address:
ae16.cr2.sjc2.us.zip.zayo.com (64.125.31.14)
The third column shows three different times in milliseconds for each packet. We can configure the number of packets to be sent by running.
traceroute -q [number of packets] Zoho.com
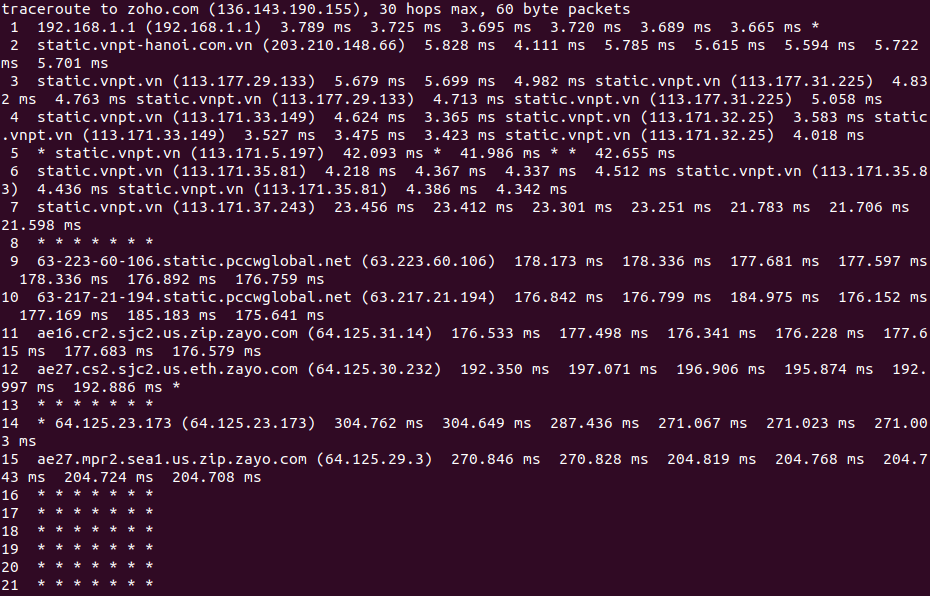 Fig. 6 :
 traceroute run with options for sending seven packets
For the full list of options that traceroute supports, run traceroute –help.
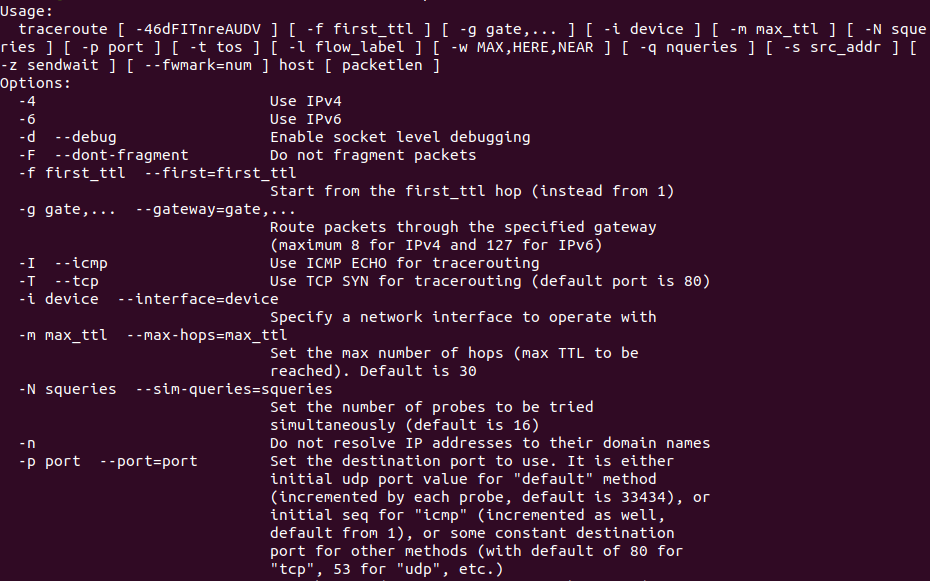 Fig. 7 :
 traceroute options
traceroute is a handy tool for determining response delays and routing loops or locating points of failure when reaching a certain destination. However, traceroute messages are often blocked by routers in many autonomous systems, which can make traceroute results inaccurate.
To make sure we get accurate information, we will first need to look up the autonomous systems with dig or whois, then combine these tools with traceroute.
The netstat tool
netstat is a command line tool that shows users all network connections at one end point in their local machine. This is useful when we want to know if a process is running successfully or whether a specific port is in use.
For example, we can run netstat on a Windows machine and see what information we’ll get.
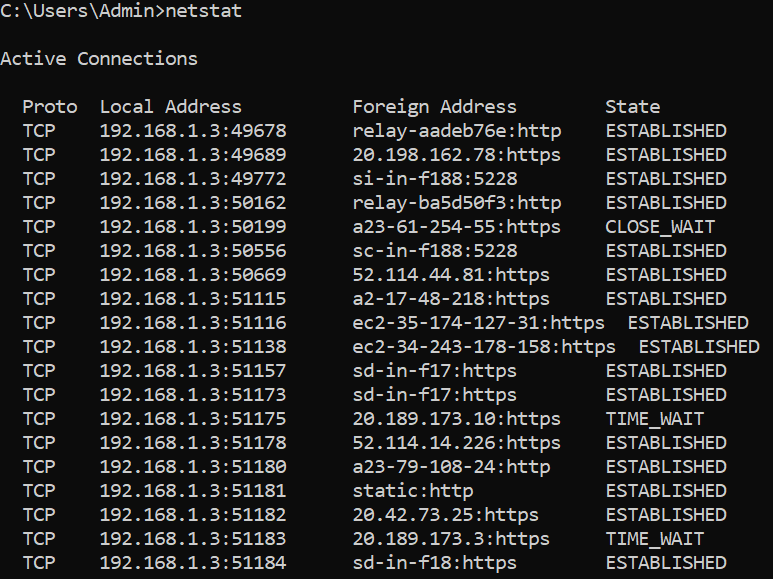 Fig. 8 :
 netstat showing a list of connections
Here we have a list showing active connections, protocols, the local address with the corresponding port, the foreign addresses, and the state of the process.
For another example, we’ll start a PostgreSQL server in our local machine, but there's an error coming up showing that port 5432 is currently in use. To find out which process is currently running on this port, we will need to combine netstat with the grep command.
netstat -ltnp | grep -w '5432'
 Fig. 9 : Check the process running on port 5432 with netstat and grep
We can see from figure 9 that there is a PostgreSQL process running on port 5432, so there’s no need to trigger the PostgreSQL server again.
netstat comes with multiple options for different scenarios. netstat –help will show us the full list of options.
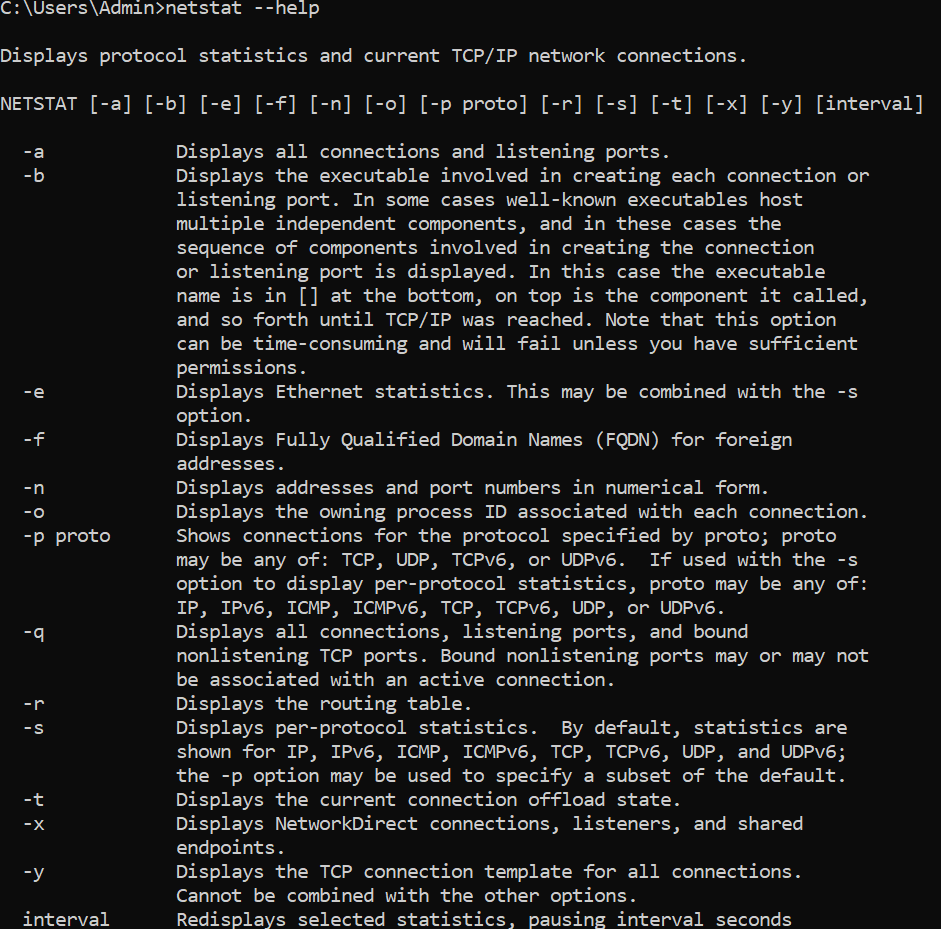 Fig. 10: The full list of
 netstat options
The main differences between ping, traceroute, and netstat
Following our introduction to the ping, traceroute, and netstat commands and their use in network troubleshooting, we will now review the main differences between them. This can help us decide when and where to use them for specific tasks.
Ping command
ping allows us to check if the local machine can reach the destination. Typically, we will use the ping command to check for network connectivity or whether the destination is still reachable.
Traceroute command
traceroute provides more information about how the connection is made during the call to the destination point. So in cases where we need more information about the destination server, the time it takes for each packet to send, or the number of hops during the connection, use traceroute. Keep in mind that the autonomous system might block traceroute calls so we need to combine this tool with others like dig or whois, for more reliable results.
Netstat command
netstat allows us to troubleshoot local machines and it shows the list of ports with the specific statuses and processes running on them. We can regularly use netstat to check if the specific port is in use or see which process is using the specific port.
Conclusion
There is no one tool to resolve every problem. We need to become familiar with the tools to choose the right one. Efficient handling of system administration tasks is key to an organization’s success. Gaining a good working knowledge of fundamental tools like ping, traceroute, and netstat will make troubleshooting easier in the future.

