Check the health and availability of your Linux servers for optimal performance with Site24x7's Linux monitoring tool.
Resolve process network usage issues
Network usage is the volume of data packets transferred in the network system, between applications, servers, devices, or processes. In this article, we’ll discuss network usage in computer processes and learn how to diagnose as well as fix potential problems related to it.
By monitoring process network usage, we can determine processes that use up an unusual amount of bandwidth. This allows us to resolve the issue and prevent the process from using bandwidth that other processes might need for their tasks.
Common metrics for process network usage
Understanding the metrics involved will help us troubleshoot more efficiently. Here are some of the most often used metrics for monitoring process network usage:
- Total packets: the total number of packets sent or received in the network system
- Total bytes: the total number of bytes transferred in the network system
- Incoming packets: packets from the outside coming to the system
- Incoming bytes: data in bytes from the outside coming to the system
- Outgoing packets: packets about to be sent to another system
- Outgoing bytes: data in bytes about to be transferred to another system
Linux tools to monitor process network usage
Several tools in the network ecosystem can be used to effectively monitor process network usage. Let’s explore (with examples) the most frequently used commands: vnstat, iftop, nethogs, nload, and iptraf.
vnstat
The vnstat command is a popular tool for monitoring network traffic on Linux servers. vnstat provides network statistics about specific network interfaces in the network system.
For example, run vnstat -m -i enp4s0 to get monthly statistics about the network interface named enp4s0.
 Fig 1:
 vnstat showing monthly statistics for the network interface
iftop
iftop is a command line tool similar to vnstat that network administrators often use to check the bandwidth of network interfaces.
For example, to monitor real-time bandwidth of the enp4s0 interface, run sudo iftop -i enp4s0
 Fig 2:
 iftop showing bandwidth in real time for the particular network interface
Network bandwidth that is going through this interface will be updated continuously.
nethogs
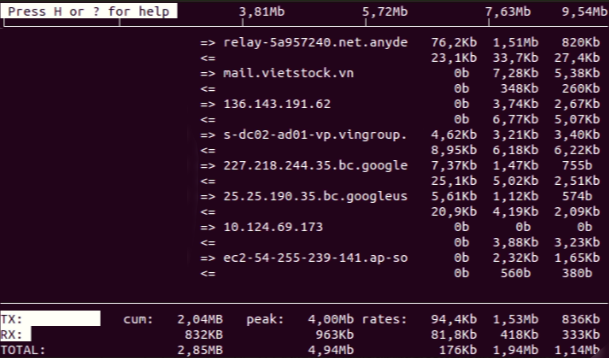
nethogs is another tool used to monitor network usage. However, unlike vnstat or iftop, nethogs automatically sorts the processes in the system by the amount of bandwidth they’re using.
For example, to identify which process is taking most of the bandwidth in the network, run sudo nethogs
 Fig 3:
 nethogs nethogs showing the process that is using the most bandwidth
The process using the most bandwidth will display at the top.
nload
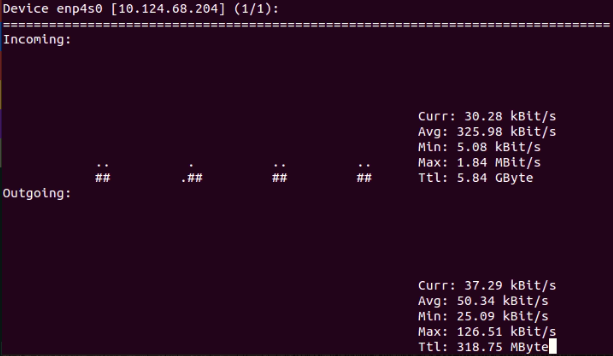
nload is an open-source tool that shows network traffic and bandwidth in the system, updated in real time.
For example, to check the incoming and outgoing traffic going through network interface enp4s0, run nload enp4s0
 Fig 4:
 nload showing the incoming and outgoing traffic in the network interface
iptraf
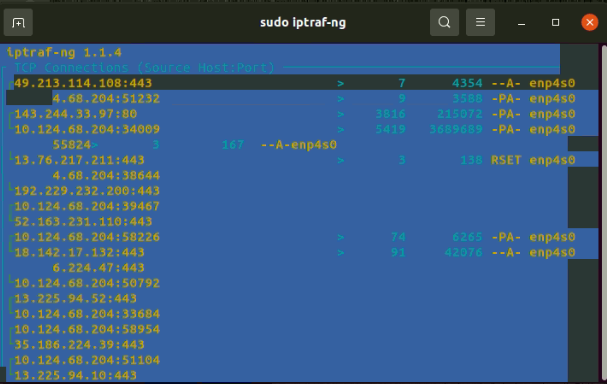
iptraf is often used to monitor the network traffic load for a specific internet protocol (IP) network.
For example, to check statistics for TCP connections for the network interface enp4s0, run sudo iptraf-ng, then select the enp4s0 network interface.
 Fig 5:
 iptraf monitoring the statistics for IP connections
The list of IP connections and the network traffic going through each IP is shown in the console screen.
Common issues around process network usage
An unusually high amount of traffic in a process signifies a need to manage the current network usage in the system more closely. Process network usage issues can escalate and lead to more serious problems in the network.
Network congestion
Network congestion occurs when there’s a heavy data load coming to the system when the current bandwidth in the network is insufficient. The consequences that can arise from network congestion include:
- Packet loss: Data loss that occurs when data is transmitted from one place to another
- Queuing delay: Occurs when a data packet is transmitted through the network. When data is sent from a source to the target, the data packet is not processed immediately when reaching the target but put in a queue instead. The time that data packets are put on hold while they’re in queue is called queue delay. The delay depends on traffic, the number of nodes between the source and the destination, and the data load that the router can handle.
- Blocking connections: Occurs when traffic volume is higher than the network system can handle. As a result, new connections to the network are automatically blocked.
High latency
Latency refers to the time it takes for data to be transferred through the network system. If latency is high, the user experience will be significantly affected by delays.
High CPU usage
High CPU usage issues typically result from multiple services or processes running in the system that take longer to execute due to a high volume of network usage. The problem can get worsewhen the network bandwidth cannot handle the load.
Finding the root cause—tips and fixes
Diagnosing and addressing process network usage problems is made more difficult by the sheer number of possible causes. Even so, common fixes can be applied in most cases.
On-premise network infrastructure
In this scenario, the network is set up on premise; the software team is not reliant on the cloud infrastructure for a network such as AWS or Microsoft Azure. If a problem with network performance arises, first check the Wi-Fi router. Wi-Fi performance can be optimized by changing the router configuration to bridge mode in gateway, or using high-bandwidth devices.
The security aspect
There could well be a security issue behind the high usage in the network. Therefore,check for any malware in the system that could be eating up network bandwidth. Open source tools like chkrootkit or ClamAV help scan the entire system.
Find the problematic process
If the development team has ruled out security issues, the next step is identifying the process using the most network bandwidth. Multiple processes can contribute to the problem; in this case the list should be narrowed down to the main suspects.
Find out why
The next step is to determine why certain processes eat up network bandwidth. There are many possible reasons for a service to do so—some of them stem from business logic, which is beyond the development team’s scope. A high volume of I/O calls, too many requests or processes that are used for media streaming can all be responsible.
Possible solutions
Once it’s clear what’s causing the process network usage problem, all that’s left is to find the solution for it. Let’s say it’s due to a high number of I/O calls—in this case, the application service code can be optimized, or a caching mechanism can be applied to reduce the number of requests. If media streaming is the culprit, the only solution is to increase the network’s bandwidth to match the expected network traffic.
Conclusion
Several different factors can contribute to network issues. In this article, we’ve covered the most common reasons behind high process network usage and learned how to monitor and troubleshoot the problem. Once the problematic process is identified, steps can be taken to prevent it from affecting other running services in the same network system.

