Port (Custom Protocol)
Track the availability of your TCP/IP ports at the set frequency from different locations. Stay alerted in case of downtime and when there is a content mismatch in the response. Now you can also monitor your dual stack infrastructure with Site24x7. This Basic Monitor is available from Starter Pack. Learn more about the various performance metrics of a Port (Custom Protocol) Monitor
Add a port (Custom Protocol) monitor
- Login to Site24x7.
- Click Admin > Inventory > Monitors > Add Monitor.
- Select Port (Custom Protocol) in Add Monitors page.
- Specify the following details to add the Port (Custom Protocol) monitor:
- Display name: Provide a appropriate name for the Port (Custom Protocol) monitor.
- Host: Specify a name for TCP/IP host.
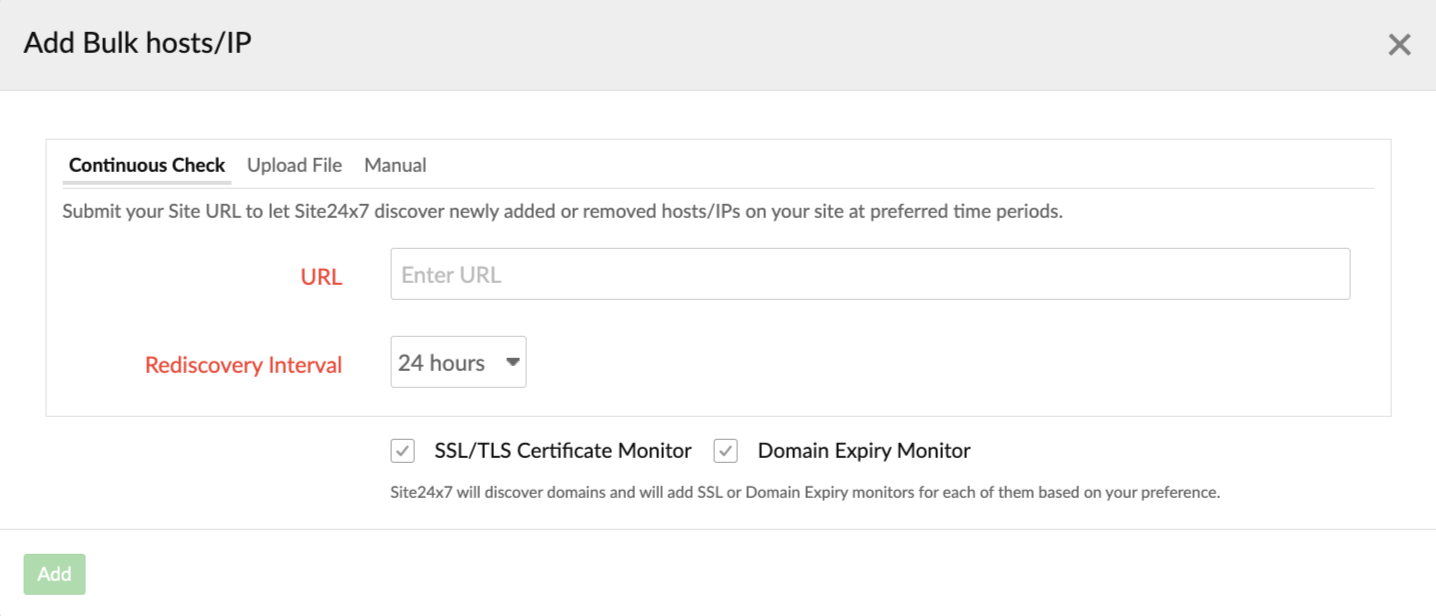
- Add Bulk Hosts/IPs: If you wish to add more hosts or IPs for monitoring in bulk, you can do the same by clicking the link Add Bulk Hosts/IPs next to the Hosts field.
- Continuous Check: You can submit your URLs to be checked continuously using this option. When the hosts/IPs are added, they will be crawled for monitoring.
To view the imported monitors, you can navigate to Admin > Import Monitors. On the Import Monitors page, you are provided with an option to disable or enable the import process. Monitors added using Continuous Check will be listed with System tag. - Upload File: You can opt to submit your hosts or IPs together as a file using this option.
- Manual: You can opt to upload your hosts or IPs directly using this option.
You can opt to add SSL/TLS Certificate monitors to get the expiry or validity of your SSL Certificates checked, or can opt to check the expiration dates of your domains by adding a Domain Expiry monitor.

- Continuous Check: You can submit your URLs to be checked continuously using this option. When the hosts/IPs are added, they will be crawled for monitoring.
- Port (TCP): Specify the port the host is listening to.
- Use Secure Connection (SSL): Use the toggle button to enable or disable a secure SSL connection.
- Application Type: Choose the appropriate application type that runs on the configured port from the drop-down.
- Port Status Check: You can now opt to get notified when the port is closed or when the port is not listening by choosing Open. Or you can get notified when the port is open or when the port is listening by choosing Close. By default, Port Status Check will be Open.
- Check Frequency: Choose the required poll frequency. The frequency can be set from 10 seconds to 1 day. 10, 15, and 30 seconds can be configured if you're using Enterprise, Enterprise Web, Enterprise Plus Web, Elite, Elite Web Packs, Team 2024, Team, and Team Web. For all other users, 1 minute will be the minimum supported check frequency.
Note
-
Configuring a 30-second check frequency will consume the license of two basic monitors.
-
Configuring a 15-second poll frequency will consume the license of four basic monitors and can be configured only with the On-Premise Poller locations.
-
Configuring a 10-second poll frequency will consume the license of six basic monitors and can be configured only with the On-Premise Poller locations.
-
- Connection Timeout: Specify time in seconds the connection need to establish with the target server.
- Command: Configure a command that can be executed through the port. You can configure commands based on the application service listening on the port.
- Prefer IPv6: If you want to connect to a Port over IPv6 enabled locations, simply move the rocker button to "YES" when creating or editing a monitor form.
Note
- Site24x7 lets you monitor your dual-stacked IPv4/IPv6 based infrastructure as per you need. IPv4 will be enabled as the default protocol. You'll be able to monitor your IPv6 infrastructure, once you enable the rocker button to IPv6. If the connectivity over IPv6 fails, it will not fall back to IPv4 automatically. Read more.
- Enabling IPv6 in the monitoring form doesn't make it compatible to monitor IPv4, by default. If you want to monitor a resource, which is compatible with both IPv4 and IPv6–you'll have to set up two separate monitor checks for this.
- Monitoring locations: Select a location profile from the drop down list from where the TCP/IP Ports can be polled from the selected location. The monitors with 10-second and 15-second poll frequencies will be supported only with On-Premise Poller locations.
To know more, refer Location Profile. - Monitor Groups: You can associate your monitor with multiple monitor groups by selecting the relevant monitor groups from the drop down list. This allows in logical grouping of your monitors.
To learn how to create a monitor group for your monitors, refer Monitor Groups. - Dependent on monitor: Select a monitor from the drop-down list to choose it as your dependent resource. You can add up to 5 monitors as dependent resources. Alerts to your monitor will be suppressed based on the DOWN status of your dependent resource.
NoteConfiguring a dependent resource and suppressing alerts based on the dependent resource's status is part of providing you with better false alerts protection. Learn more about alert suppression at monitor level.
NoteIf you select None in the dependent resource field, alerting will progress as per your normal configuration settings. No alerts will be suppressed in this case as the monitor doesn't have any dependent resource.
NoteMultiple monitor group support for monitors allow a monitor to be associated with multiple dependent resources in different monitor groups. If during a normal monitor status check, any one of these dependent resources' status is identified as DOWN, the alert for the monitor will be automatically suppressed. However, the dependency configuration at monitor level is always given the higher priority over any other monitor group level dependency configuration for suppressing alerts.
- Specify the following details for Content Checks:
- Should contain string(s): Get alerted when the specified keywords are not found by the monitoring servers. Mention the keywords in the check box and use the slider button to trigger the required alert.
- Should not contain string(s): Get alerted when the specified keywords which should not be present are found by monitoring servers. Mention the keywords in the check box and use the slider button to trigger the required alert.
Note
You must adhere to the following conditions while adding keywords in the given field:
- A single string or keyword can be configured with/without any double quotes (ex: HTML).
- If there are two strings, which comprise a single keyword–add a space in between the two strings and enclose it with double quotes. (ex: "HTML response").
- In case you have more than a couple of individual keywords configured, you will have to separate them with a space and also use double quotes for each of them. ("monitor" "HTML").
- Learn more about Content Checks.

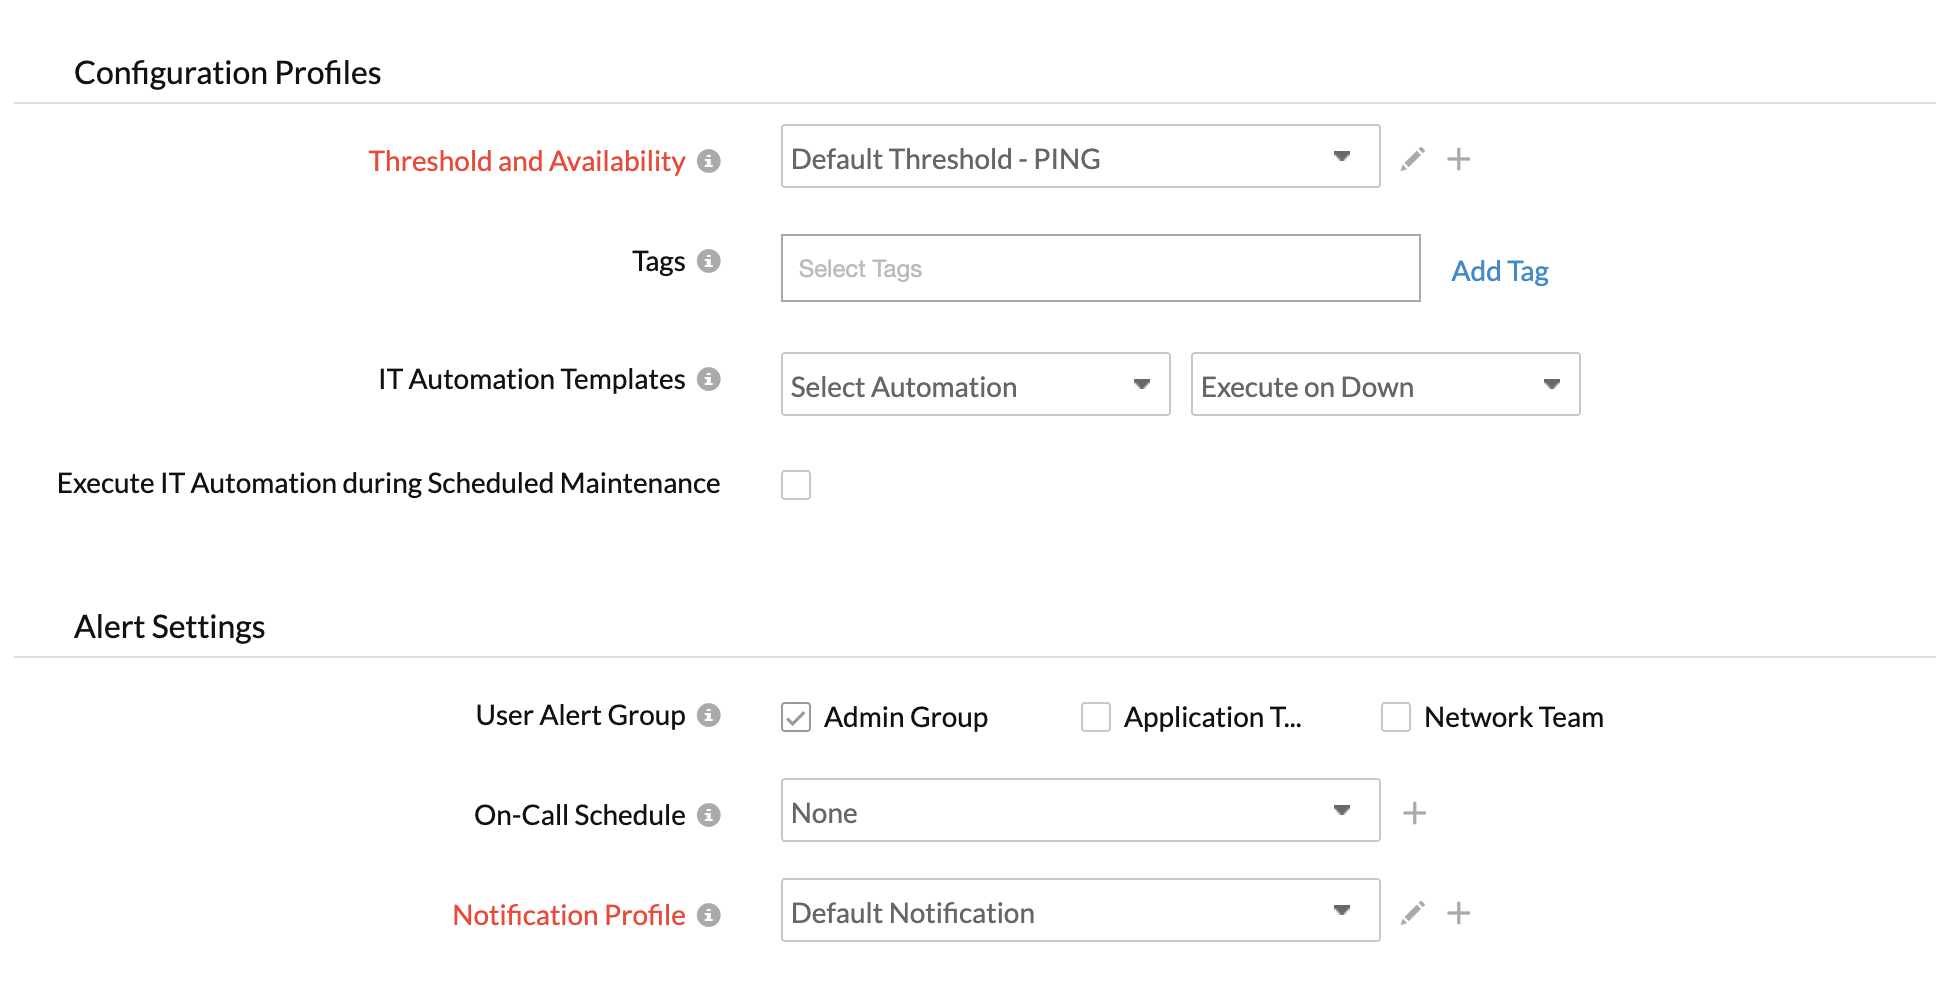
- Specify the following details for Configuration Profiles:
- Threshold and Availability: Select a threshold profile from the drop down list or choose the default threshold set available and get notified when the resources cross the configured threshold and availability.
To create a customized profile, refer Threshold and Availability. - Tags: Associate your monitor with predefined Tag(s) to help organize and manage your monitors creatively. Learn how to add Tags.
- IT Automation: Select an automation to be executed when the website is down/trouble/up/any status change/any attribute change. The defined action gets executed when there is a state change and selected user groups are alerted.
To automate corrective actions on failure, refer IT Automation.

- Threshold and Availability: Select a threshold profile from the drop down list or choose the default threshold set available and get notified when the resources cross the configured threshold and availability.
- Alert Settings:
- User Alert Group: Select the user group that need to be alerted during a outage. To add multiple users in a group, see User Alert Group.
- On-Call Schedule: The On-Call Schedule option helps you to ensure that the notifications are sent to assignees in specific shift hours helping them to quickly respond to alerts or incidents. Choose an On-Call of your preference from the drop-down.
- Notification Profile: Choose a notification profile from the drop down or select the default profile available. Notification profile helps to configure when and who needs to be alerted in case of downtime. Refer Notification Profile to create a customized notification profile.
NoteYou can receive alerts if the monitors are associated to user groups irrespective of the On-Call shift you've configured.
- Third-Party Integrations: Associate your monitor with a pre-configured third-party service. It lets you push your monitor alarms to selected services and facilitates improved incident management.
NoteIf you haven't set up any integrations yet, navigate across to Admin > Third Party Integration to create one. Tell me more.
- Click Save. You can click Check and Save if you want to run the configurations and see whether the monitor is performing well and then get the monitor saved. In case of an error, the monitor will not be saved.
NoteOnce the monitor setup is completed, the Site24x7 deep discovery wizard scans your domain and auto-detects all related internet resources for your domain that can be added to your account for comprehensive internet services monitoring. Explore more about internet services deep discovery.
Read our new blog on Remote Monitoring.
