UDP Monitor
Track the availability of your User Datagram Protocol (UDP) ports from different locations. UDP is a connection-less protocol effective in time-sensitive applications like real-time systems. With the help of a Site24x7 UDP monitor, you can get alerted about any downtime or when there is a content mismatch in the response. With the Basic Monitor available in the Starter pack, you can also monitor your dual stack infrastructure.
Add a UDP monitor
- Log in to Site24x7.
- Click Admin > Inventory > Monitors > Add Monitor.
- Select UDP in the Add Monitors page.
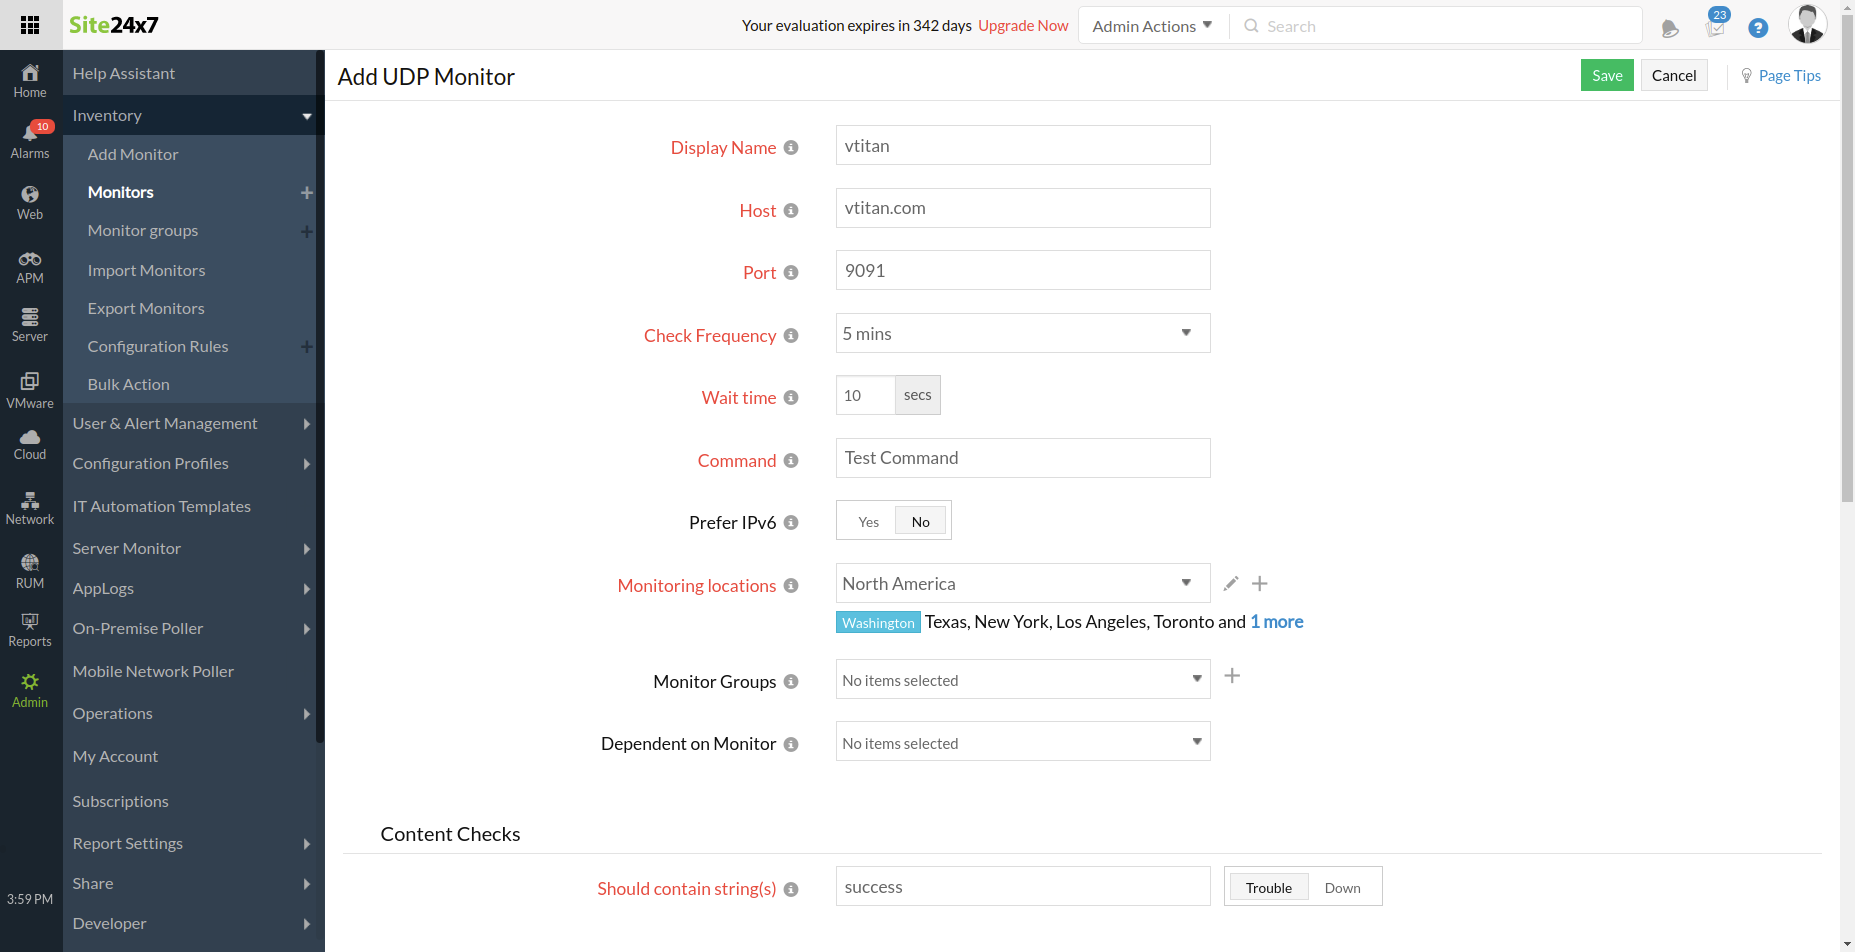
- Specify the following details to add the UDP monitor:
- Display name: Provide an appropriate name for the UDP monitor.
- Host: Specify a name for the UDP host. You can provide domain names or IP addresses.
- Port (UDP): Specify the port the host is listening to.
- Check frequency: Choose the required polling frequency. The frequency can be set from 30 seconds to 1 day. 30 seconds can be configured if you're using Enterprise, Enterprise Web, Enterprise Plus Web, Elite, and Elite Web Packs. For all other users 1 minute will be the minimum supported check frequency.
Note
Configuring 30 seconds check frequency will be consuming the license of two basic monitors.
- Wait time: Specify the waiting time in seconds to receive a server response.
- Command: Configure a command that can be executed through the UDP port. You can configure commands based on the application service listening on the UDP port. Use the below format to configure a command in the Hex format.
HEX(<Hex Stream>)
Example : HEX(7496012000010000000000010377777708736974653234783703636f6d00000100010000291000000000000000) - Prefer IPv6: If you want to connect to a Port over IPv6 enabled locations, simply move the toggle button to YES when creating or editing a monitor form.
Note
Site24x7 lets you monitor your dual-stacked IPv4/IPv6-based infrastructure as per you need. IPv4 will be enabled as the default protocol. You'll be able to monitor your IPv6 infrastructure once you toggle the button to IPv6. If the connectivity over IPv6 fails, it will not fall back to IPv4 automatically. Read more.
Enabling IPv6 in the monitoring form doesn't make it compatible to monitor IPv4 by default. If you want to monitor a resource that is compatible with both IPv4 and IPv6, you'll have to set up two separate monitor checks for this. - Monitoring locations: Select a location profile from the drop-down list from where the UDP Ports can be polled from the selected location.Learn more about Location Profiles.

- Monitor Groups: You can associate your monitor with multiple monitor groups by selecting the relevant monitor groups from the drop-down list. This allows logical grouping of your monitors. Learn how to create a monitor group for your monitors.
- Dependent on monitor: Select a monitor from the drop-down list to choose it as your dependent resource. You can add up to five monitors as dependent resources. Alerts to your monitor will be suppressed based on the DOWN status of your dependent resource.
Configuring a dependent resource and suppressing alerts based on the dependent resource's status is part of providing you with better false alert protection. Learn more about alert suppression at the monitor level.
If you select None in the dependent resource field, alerting will progress as per your normal configuration settings. No alerts will be suppressed in this case, as the monitor doesn't have any dependent resource.
Multiple monitor group support allows a monitor to be associated with multiple dependent resources in different monitor groups. During a normal monitor status check, if any one of these dependent resources' status is identified as DOWN, the alert for the monitor will be automatically suppressed. However, the dependency configuration at the monitor level is always given the higher priority over any other monitor group level dependency configuration for suppressing alerts.
5. Specify the following details for Content Checks:
Should contain string(s): Get alerted when the specified keywords are not found by the monitoring servers.Use the below format to configure a content check in
the Hex format.
HEX(<Hex Stream>)
Example : HEX(0004888fbee20000290200000000000000)
Learn more about Content Checks.
6. Specify the following details for Configuration Profiles:
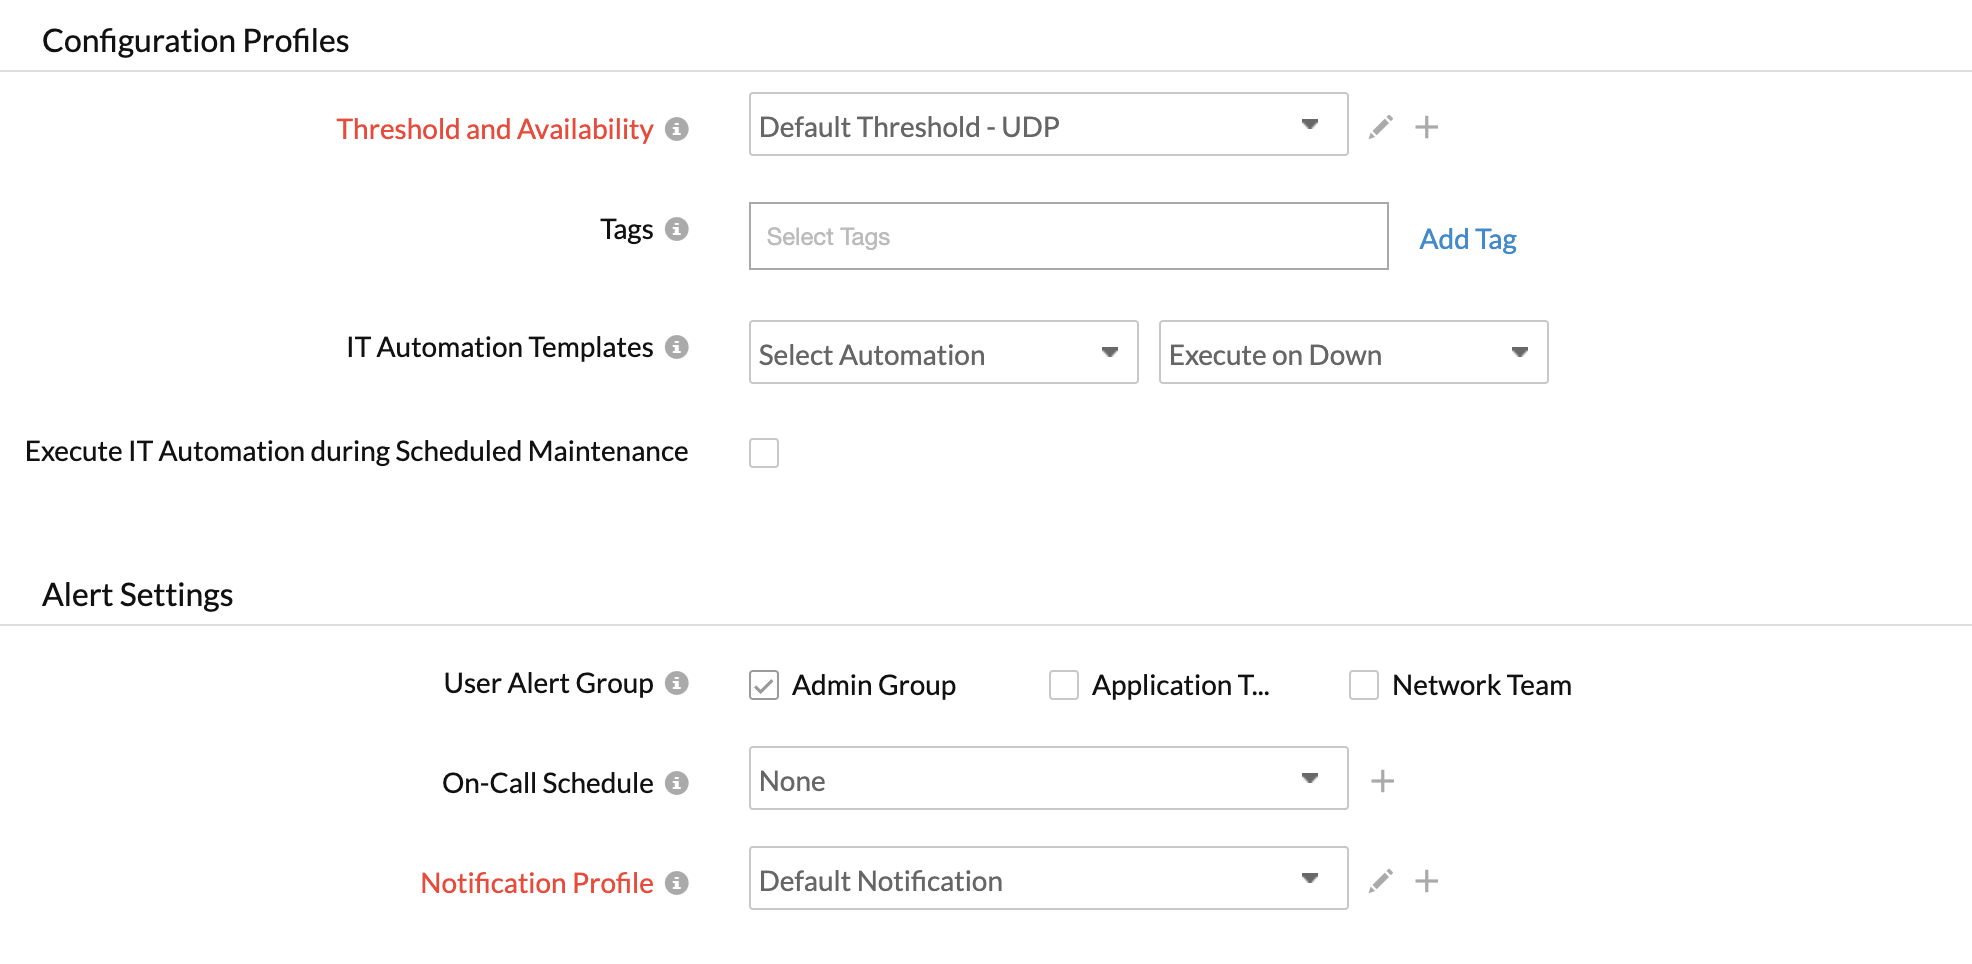
- Threshold and Availability: Select a threshold profile from the drop-down list, or choose the default threshold set available, and get notified when the resources cross the configured threshold and availability. To create a customized profile, refer to Threshold and Availability.
- Tags: Associate your monitor with predefined Tag(s) to help organize and manage your monitors creatively. Learn how to add Tags.
- IT Automation: Select an automation to be executed when the website is down, in trouble, or up, or experiences any status change or attribute change. The defined action gets executed when there is a state change, and selected user groups are alerted. To automate corrective actions responding to failures, refer to IT Automation.

7. Alert Settings:
-
- On-Call Schedule: The On-Call Schedule option helps you to ensure that the notifications are sent to assignees in specific shift hours helping them to quickly respond to alerts or incidents. Choose an On-Call of your preference from the drop-down.
- User Alert Group: Select the user group that needs to be alerted during an outage. To add multiple users in a group, see User Alert Group.
- Notification Profile: Choose a notification profile from the drop-down or select the default profile available. Notification profiles help with configuring when and who needs to be alerted in case of downtime. Learn how to create a customized notification profile.
NoteYou can receive alerts if the monitors are associated to user groups irrespective of the On-Call shift you've configured.
8. Third-Party Integrations: Associate your monitor with a preconfigured third-party service. This lets you push your monitor alarms to selected services and facilitate improved incident management. If you haven't set up any integrations yet, navigate to Admin >Third-Party Integration to create one. Learn more.
9. Click Save.
Once the monitor setup is complete, Site24x7's deep discovery wizard scans your domain and auto-detects all related internet resources for your domain that can be added to your account for comprehensive internet services monitoring. Explore more about internet services deep discovery.
