Webpage Speed (Browser)
The Webpage Speed (Browser) provides a split up of your website components and tracks individual component's load time, response time, status, component size and more using a real web browser. It loads your webpage in a real browser to analyze all its resources and get a PageSpeed Insights report. Additionally, our browser agent will correctly identify and show you the HTTP protocol (version 1.1 / 2.0) that was used to render your resource. You can carry out webpage speed monitoring from our 130 global monitoring locations or a Private location (using Linux flavour based On-Premise Poller).
Add a Webpage Speed (Browser)
- Log in to Site24x7.
- Click Admin > Inventory > Monitors > Add Monitor > Webpage Speed (Browser).
- Select Webpage (Browser) from Add Monitor page.
- Specify the following details to add the Webpage Speed (Browser):
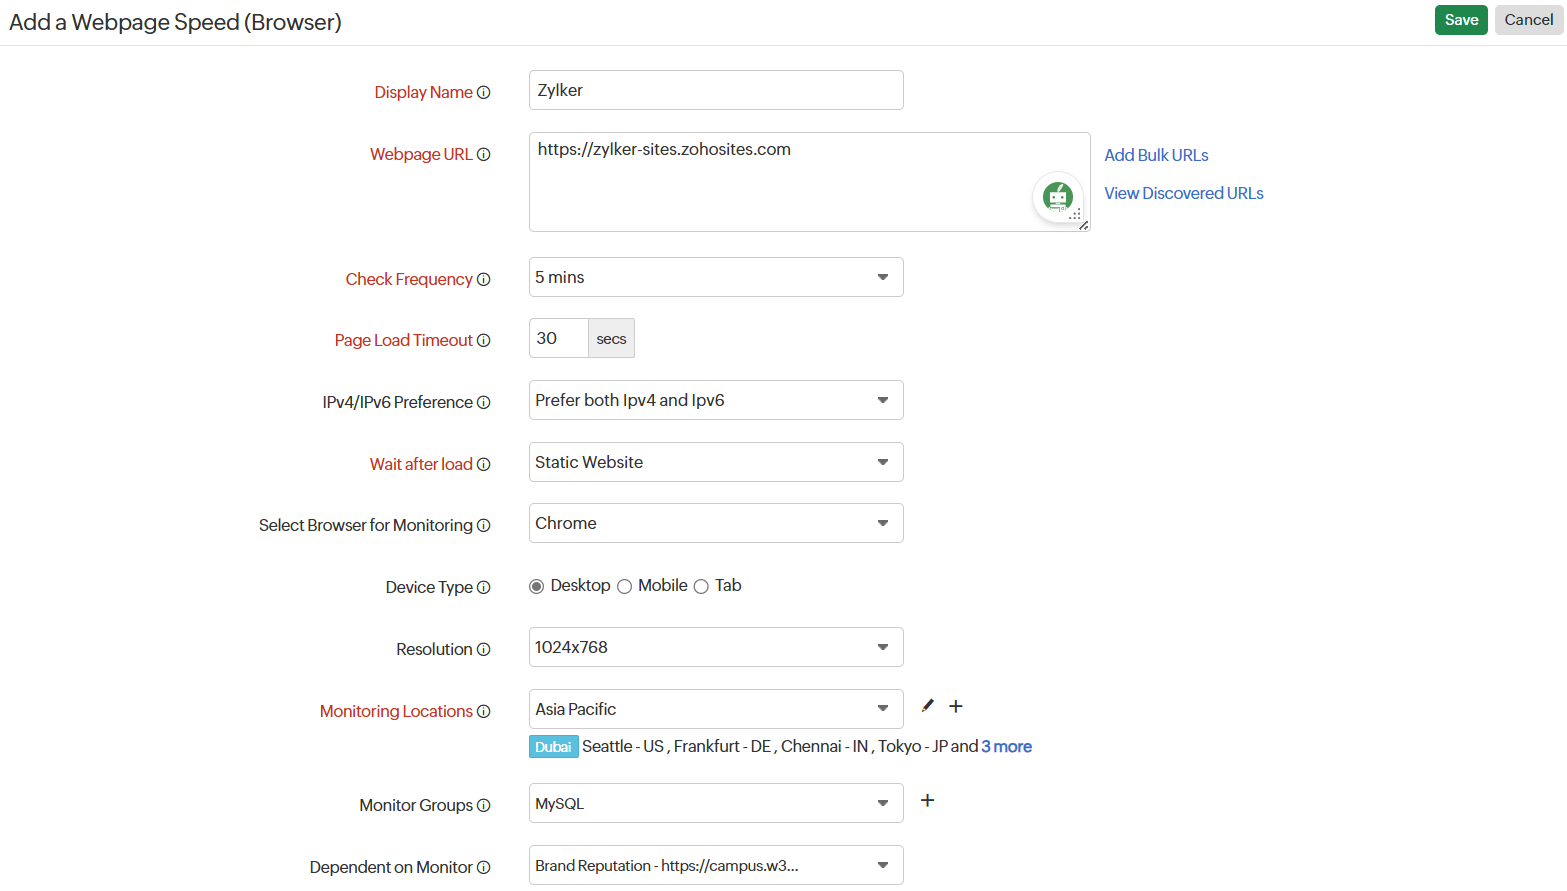
- Display Name: Provide a appropriate name for the webpage.
- Webpage URL: Type the URL which needs to be monitored.
- Add Bulk URLs: If you wish to add more URLs in bulk for monitoring, you can do the same by clicking the link Add Bulk URLs next to the Webpage URLfield.
- Continuous Check: Take for instance that you've a sitemap where many URLs are listed, you can submit the sitemap URL along with a Rediscovery Interval or frequency for the sitemap to be checked. This can help in automatically adding or removing the URLs that were added or removed. Moreover, the monitors added for the URLs will be suspended when the URL is removed from the sitemap. Also, the monitors will be added in bulk based on your license limit. When URLs are added, the URLs will be crawled for monitoring. You can also submit your URLs in CSV format.
Read this to know more about submitting in CSV format. To view the imported monitors, you can navigate to Admin > Import Monitors. On the Import Monitors page, you are provided with an option to disable or enable the import process. Monitors added using Continuous Check will be listed with System tag. - Upload File: You can opt to submit your URLs together as a file using this option.
- Manual: You can opt to upload your URLs directly using this option.
You can opt to add SSL/TLS Certificate monitors to check the validity of your SSL Certificates or can opt to keep a track of the expiration dates of your domains using Domain Expiry monitors.
- Continuous Check: Take for instance that you've a sitemap where many URLs are listed, you can submit the sitemap URL along with a Rediscovery Interval or frequency for the sitemap to be checked. This can help in automatically adding or removing the URLs that were added or removed. Moreover, the monitors added for the URLs will be suspended when the URL is removed from the sitemap. Also, the monitors will be added in bulk based on your license limit. When URLs are added, the URLs will be crawled for monitoring. You can also submit your URLs in CSV format.
- View Discovered URLs: Click on the View Discovered URLs link to view a list of all the discovered resources available in your monitors. Select the desired URLs, then click Add. Learn more about discovered resources.
- Check Frequency: Provide the required poll interval. The frequency can be set from 15 minutes to 1 day.
- Page Loading Timeout: Specify the time in seconds that it takes to establish a connection with the target server. When connection is not established, the website will be reported as down with "Could not establish connection" as the reason.
- Prefer IPv6: If you want to monitor your website over IPv6 enabled locations, simply move the rocker button to "YES" when creating or editing a monitor form.
Note
- Site24x7 lets you monitor your dual-stacked IPv4/IPv6 based infrastructure as per you need. IPv4 will be enabled as the default protocol. You'll be able to monitor your IPv6 infrastructure, once you enable the rocker button to IPv6. If the connectivity over IPv6 fails, it will not fall back to IPv4 automatically. Read more.
- Enabling IPv6 in the monitoring form doesn't make it compatible to monitor IPv4, by default. If you want to monitor a resource, which is compatible with both IPv4 and IPv6–you'll have to set up two separate monitor checks for this.
- Wait after load: Specify your website type, i.e., Static, Dynamic, or Flash-based website.
NoteAnalysis is delayed for 10 seconds after the page loads to allow scripts and events to complete.
- Select Browser for Monitoring: Choose the browser of your preference from the options provided.The selected browser will be used for data collection.
- Device Type: Choose from Desktop, Mobile, or Tab.
- Resolution: Each device type supports different resolutions. Choose your preferred device resolution.
- Desktop: 1024x768, 1366x768, 1600x900, and 1920x1080
- Mobile: iPhone 6/7/8 Plus, iPhone12/13 + Pro, Galaxy S20, Galaxy Note20, Pixel 2, and Pixel 2XL
- Tab: iPad, Surface Duo, and iPad Pro
Note
- The resolution change is handled at the browser-level only.
- The device type and resolution that you choose will update the previously configured customized user agent, if any.
- Monitoring Locations: Choose a global location or Private location from the dropdown list to setup monitoring of your website from this location. Choose your Linux flavor based On-Premise Poller from the drop down to customize your Private location. Additionally, customize and create location profiles based on your requirements.
To know more, refer Location Profile.

- Monitor Groups: You can associate your monitor with multiple monitor groups by selecting the relevant monitor groups from the drop down list. This allows in logical grouping of your monitors.
To learn how to create a monitor group for your monitors, refer Monitor Groups. - Dependent on monitor: Select a monitor from the drop-down list to choose it as your dependent resource. You can add up to 5 monitors as dependent resources. Alerts to your monitor will be suppressed based on the Down status of your dependent resource.
NoteConfiguring a dependent resource and suppressing alerts based on the dependent resource's status is part of providing you with better false alerts protection. Learn more about alert suppression at monitor level.
NoteIf you select "None" in the dependent resource field, alerting will progress as per your normal configuration settings. No alerts will be suppressed in this case as the monitor doesn't have any dependent resource.
NoteMultiple monitor group support for monitors allow a monitor to be associated with multiple dependent resources in different monitor groups. If during a normal monitor status check, any one of these dependent resources' status is identified as DOWN, the alert for the monitor will be automatically suppressed. However, the dependency configuration at monitor level is always given the higher priority over any othermonitor group level dependency configuration for suppressing alerts.
-
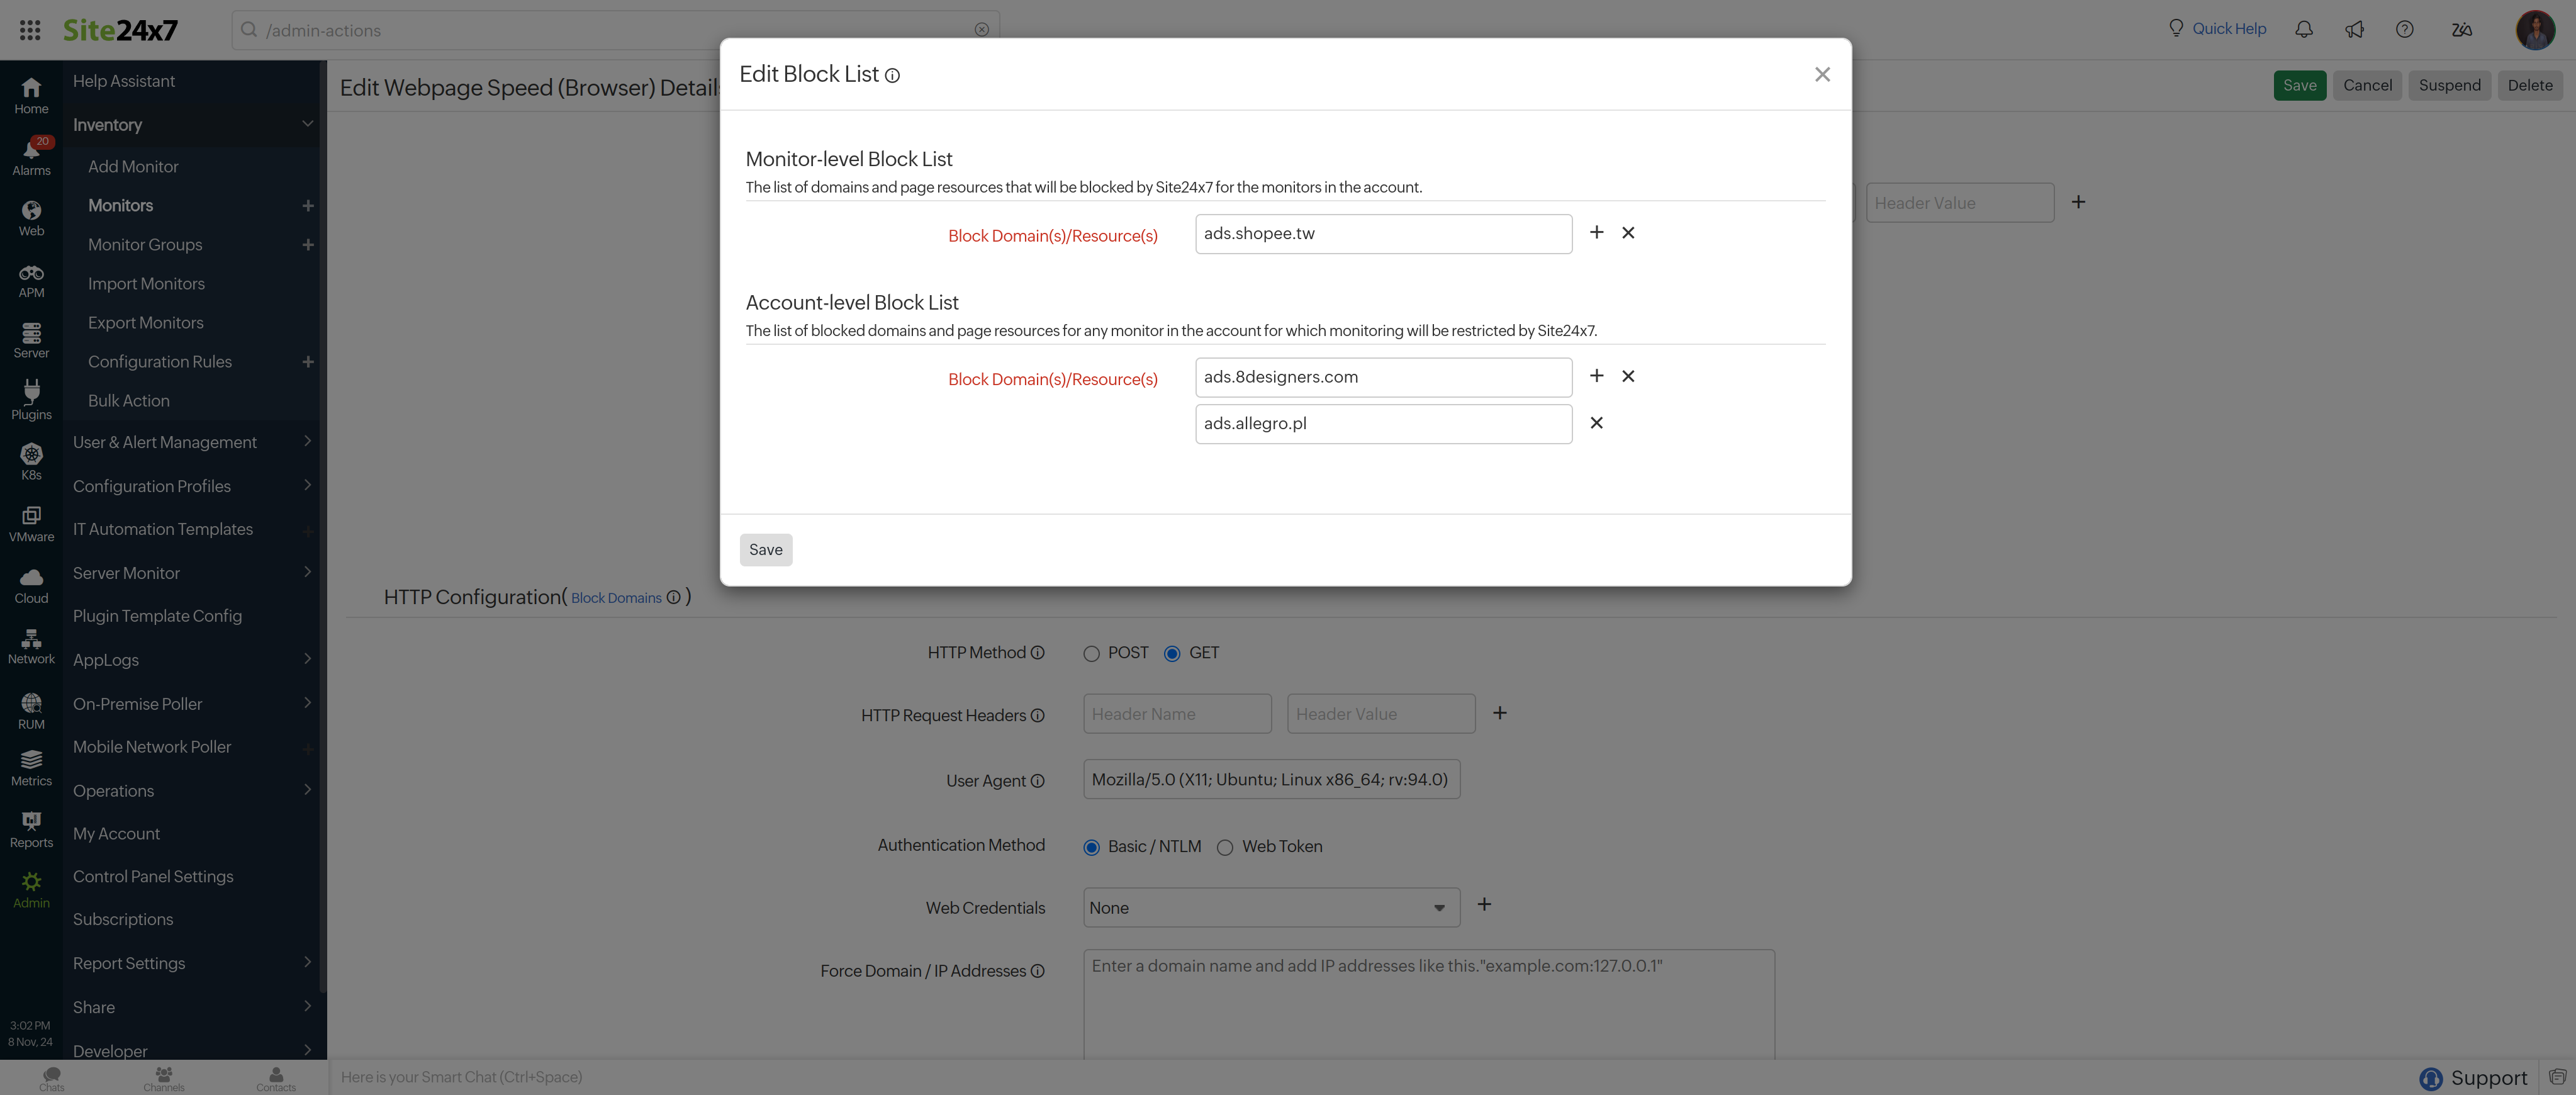
- You can build a block domain list to restrict monitoring of these domains. Click the Block domains link. When you click the link, you'll be prompted with a pop up window, where you'd be asked to add the domain(s) or the resources at the Monitor-level or Account-level.
NoteIf you've specified block domain(s) at Monitor level, the traffic from the domain gets excluded for the specified monitor alone. However, if you've specified the domain(s) at the Account level, the traffic from the domain gets excluded globally across all your monitors in your Site24x7 account.

- You can build a block domain list to restrict monitoring of these domains. Click the Block domains link. When you click the link, you'll be prompted with a pop up window, where you'd be asked to add the domain(s) or the resources at the Monitor-level or Account-level.
-
- HTTP Method: Specify the method to be used for connecting with the site– GET or POST. Select the radio buttons to configure the form submission method and appropriate body type for the POST HTTP Method.
NoteIn the GET method, the entire HTML response is fetched and checked for the presence of your configured keywords.
NotePOST method would submit the parameters to access the URL.
- HTTP Request Headers: Add a header name and header value to customize the header information in the HTTP Request Headers field.
- Adding cookies to the request header:
To include a cookie in the request header, set the header name as setBrowserCookie and provide the header value in the following format:
cookiename1=cookievalue1,cookiename2=cookievalue2
When you define the request header as setBrowserCookie, a Cookie Domain text box will appear for you to enter the domain associated with the cookie.
NoteThe Cookie Domain text box will be available only if the web token profile has the setBrowserCookie configuration.
- Adding cookies to the request header:
- User Agent: Configure a customized user agent (web browser) for sending your request and the HTTP headers to data collection. You can choose from the available user agents.
Learn more about browser versions used in the Synthetic Web Transaction (Browser) monitor. - Authentication Method: Specify the radio button and update the credentials accordingly.
- Basic/NTLM Credentials: Configure your Basic/NTLM-based authorization. Windows NTLM is the authentication protocol used on systems running on Windows.
- Web Credentials: Choose your web credentials for URLs requiring Basic/NTLM-based authentication from the drop-down. Learn how to add/edit credentials.
- Web Token: Register Site24x7 with your authentication server to monitor protected resources using web tokens. Learn how to add web tokens.
- Web Token Name: Select the Web Token Name from your preconfigured list or create a new Web Token by clicking the + button.
NoteTo include cookie details or specify a global parameter, use the provided credentials or add the Cookie Domain by setting the header name to setBrowserCookie. Learn how to set cookies and include multiple tokens.

- Web Token Name: Select the Web Token Name from your preconfigured list or create a new Web Token by clicking the + button.
- Basic/NTLM Credentials: Configure your Basic/NTLM-based authorization. Windows NTLM is the authentication protocol used on systems running on Windows.
- Force Domain/IP addresses: You can provide the specific domain name or a list of IPv4 or IPv6 addresses to be used instead of the DNS resolved IP addresses.
NoteYou must enter one IPv4 or IPv6 address per line, in order of preference.
- Accepted HTTP status codes: Provide a comma-separated list of HTTP status codes that indicate a successful response. You can specify individual status codes, as well as ranges separated with a colon. Learn about HTTP status codes.
- Trust the Server SSL Certificate: Choose Yes to accept the certificate and to ignore the validation error. You can choose No to validate the certificate and to get alerted when the validation fails.
- HTTP Method: Specify the method to be used for connecting with the site– GET or POST. Select the radio buttons to configure the form submission method and appropriate body type for the POST HTTP Method.
6. Specify the required details for Content Checks:
-
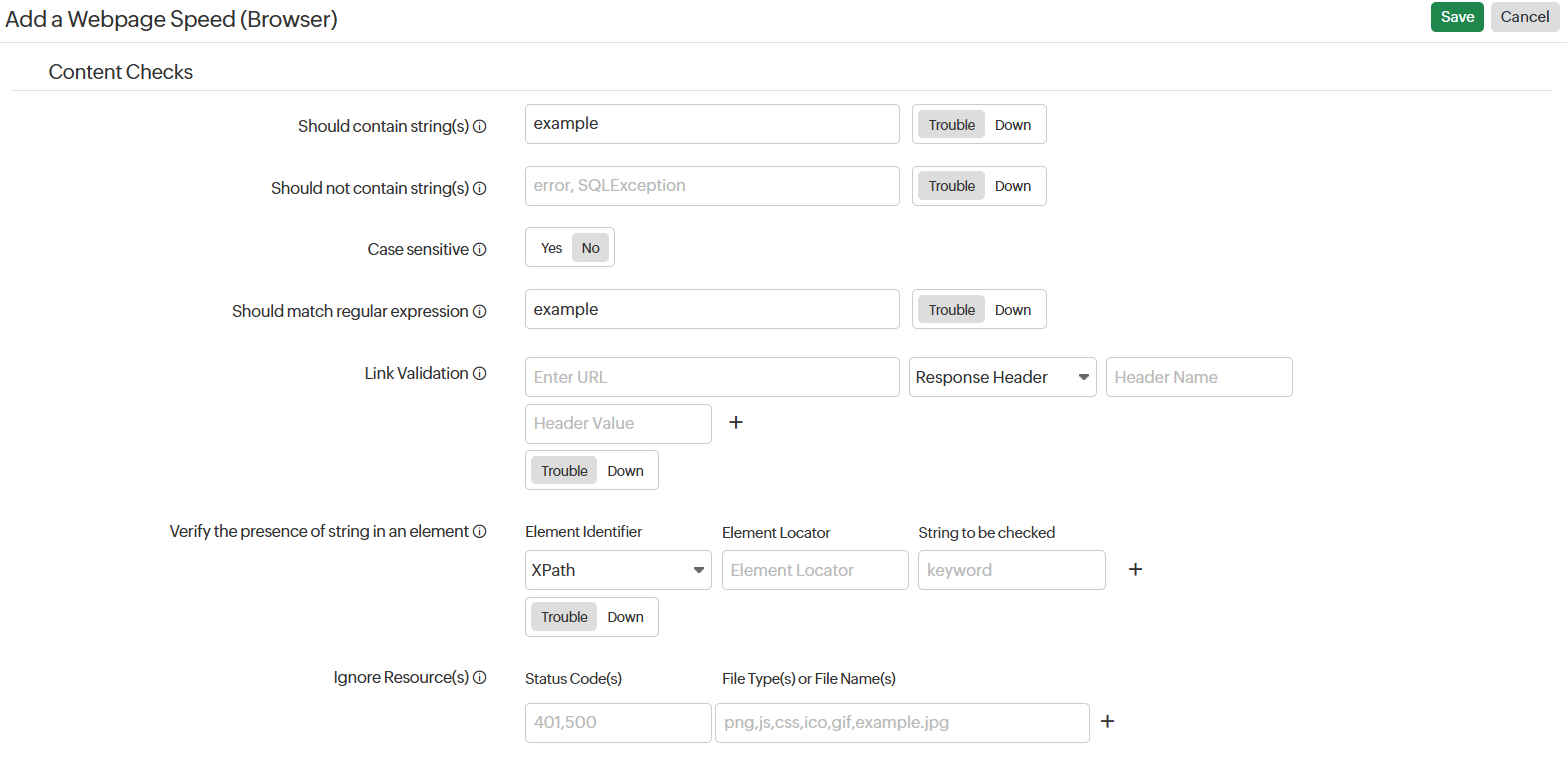
- Should contain string(s): Get alerted when the specified keyword are not present in the website. Mention the keywords in the check box and use the slider button to trigger the required kind of alert.
- Should not contain string(s): Get alerted when specified keywords are present in the website content. Mention the keywords in the check box and use the slider button to trigger the required kind of alert.
Note
You must adhere to the following conditions while adding keywords in the given field:
- A single string or keyword can be configured with/without any double quotes (ex: HTML).
- If there are two strings, which comprise a single keyword–add a space in between the two strings and enclose it with double quotes. (ex: "HTML response").
- In case you have more than a couple of individual keywords configured, you will have to separate them with a space and also use double quotes for each of them. ("monitor" "HTML").
- Case sensitive: Enable the toggle button to detect case sensitive characters.
- Should match regular expression: Configure your alert based on whether a particular pattern matches with the website content.
For example: When you consider the expression ^[a-z0-9_-]{3,15}$, your website content should contain alphabets from a to z,numbers from 0 to 9 , underscore and a hyphen. Also there should be minimum length of 3 characters and maximum length of 15 characters. When it is not matched, your website will be reported as "Regular expression"^[a-z0-9_-]{3,15}$" does not match" as a reason.NoteLearn more about content checks and negative lookaheads in regular expression match.
- Link Validation: Provide the URL to enable link validation. Use the toggle button to set trouble or down status when the preferred URL standard isn't met. You can use the drop-down option to choose the Response Header or Request Header, and then provide the Header Name and Header Value. If you wish to specify some conditions in regular expression, you can do that by using the format: $[value] .
- Verify the presence of string in an element: To verify the presence of specified keywords within a particular HTML element, you can provide the specific element identifiers. Follow this by specifying the element locator in accordance with the Selenium element identifier formats. Additionally, you can indicate the string that needs to be checked.
- Ignore Resource(s): Provide the status code and file type or file name of those page resources for which you wish not to receive alerts. You can provide the status codes or files as comma-separated values(501,502) or as a range separated by a colon (501:508). You can also provide file type details of configured RegEx values in the following format: $[value]. You can choose to ignore resources only if you've enabled Notify when the broken links exceed option.

7. Specify the required details for Configuration Profiles:
-
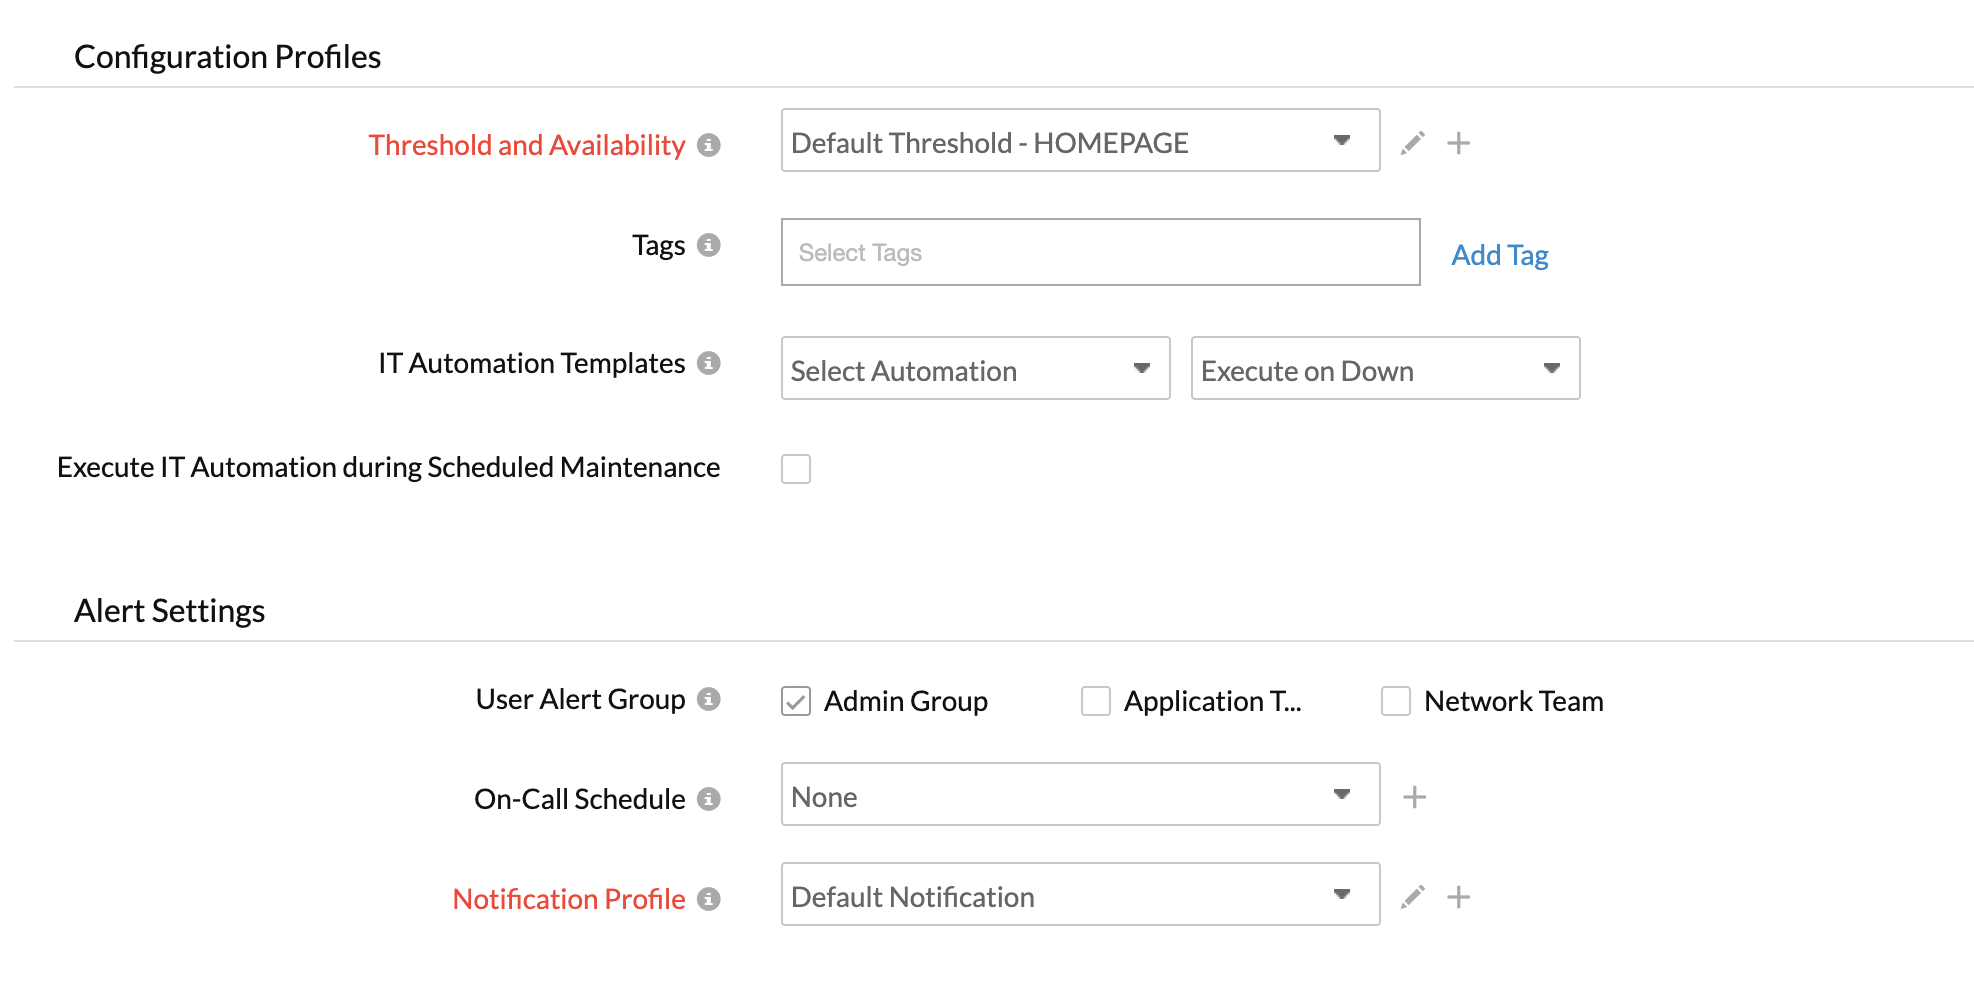
- Threshold and Availability: Select a threshold profile from the drop down list or choose the default threshold set available and get notified when the resources cross the configured threshold and availability.
To create a customized threshold and availability profile, refer Threshold and Availability. - Tags: Associate your monitor with predefined Tag(s) to help organize and manage your monitors creatively. Learn how to add Tags.
- IT Automation: Select an automation to be executed when the website is down/trouble/up/any status change/any attribute change. The defined action gets executed when there is a state change and selected user groups are alerted.
To automate corrective actions on failure, refer IT Automation.

- Threshold and Availability: Select a threshold profile from the drop down list or choose the default threshold set available and get notified when the resources cross the configured threshold and availability.
- Alert Settings:
- User Alert Group: Select the user group that need to be alerted during a outage. To add multiple users in a group, see User Groups.
- On-Call Schedule: The On-Call Schedule option helps you to ensure that the notifications are sent to assignees in specific shift hours helping them to quickly respond to alerts or incidents. Choose an On-Call of your preference from the drop-down.
- Notification profile: Choose a notification profile from the drop down list or select the default profile available. Notification profile helps to configure when and who gets notified in case of downtime. Refer Notification Profile to create a customized notification profile.
NoteYou can receive alerts if the monitors are associated to user groups irrespective of the On-Call shift you've configured.
- Third-Party Integration: Associate your monitor with a pre-configured third-party service. It lets you push your monitor alarms to selected services and facilitate improved incident management.
NoteIf you haven't setup any integrations yet, navigate across to ”Admin > Third-Party Integration” to create one. Tell me more.
8. Click Save.
Once the monitor setup is completed, Site24x7 deep discovery wizard scans your domain and auto detects all related internet resources for your domain that can be added to your account for a comprehensive internet services monitoring. Explore more about internet services deep discovery.
Uptime Steroid
Uptime Steroid is a feature that helps to check the availability of your first URL in the sequence by polling every 1 minute. This will help in identifying status of the URL. When you add a Web Transaction (Browser) monitor Uptime Steroid will be enabled by default.If you wish to disable this option you can click on the hamburger icon, and then choose Disable Uptime Steroid. Also, after disabling this option you can enable anytime, by using the Edit option. Learn more about Uptime Steroid.
Interpret Webpage Speed (Browser) Results
Learn more about the various performance metrics of a Webpage Speed (Browser). You can obtain a detailed report on the performance of your CDNs.
To understand the distinction between various internet services monitoring features, read more.
Troubleshooting Tips:
