Performance Metrics of OpenTelemetry
Monitoring your applications with Site24x7 OpenTelemetry allows you to track and measure key metrics such as response time, request count, exception count, and more directly from the Site24x7 console itself.
To begin:
- Log in to the Site24x7 web client.
- Navigate to APM > Opentelemetry.
Access the following tabs to obtain various parameters and metrics:
- You can select the required application and service from the Services drop-down menu to view the corresponding metrics.
- You can also choose All Services from the drop-down menu to see the overall metrics (metrics for all the applications and services).
Overview
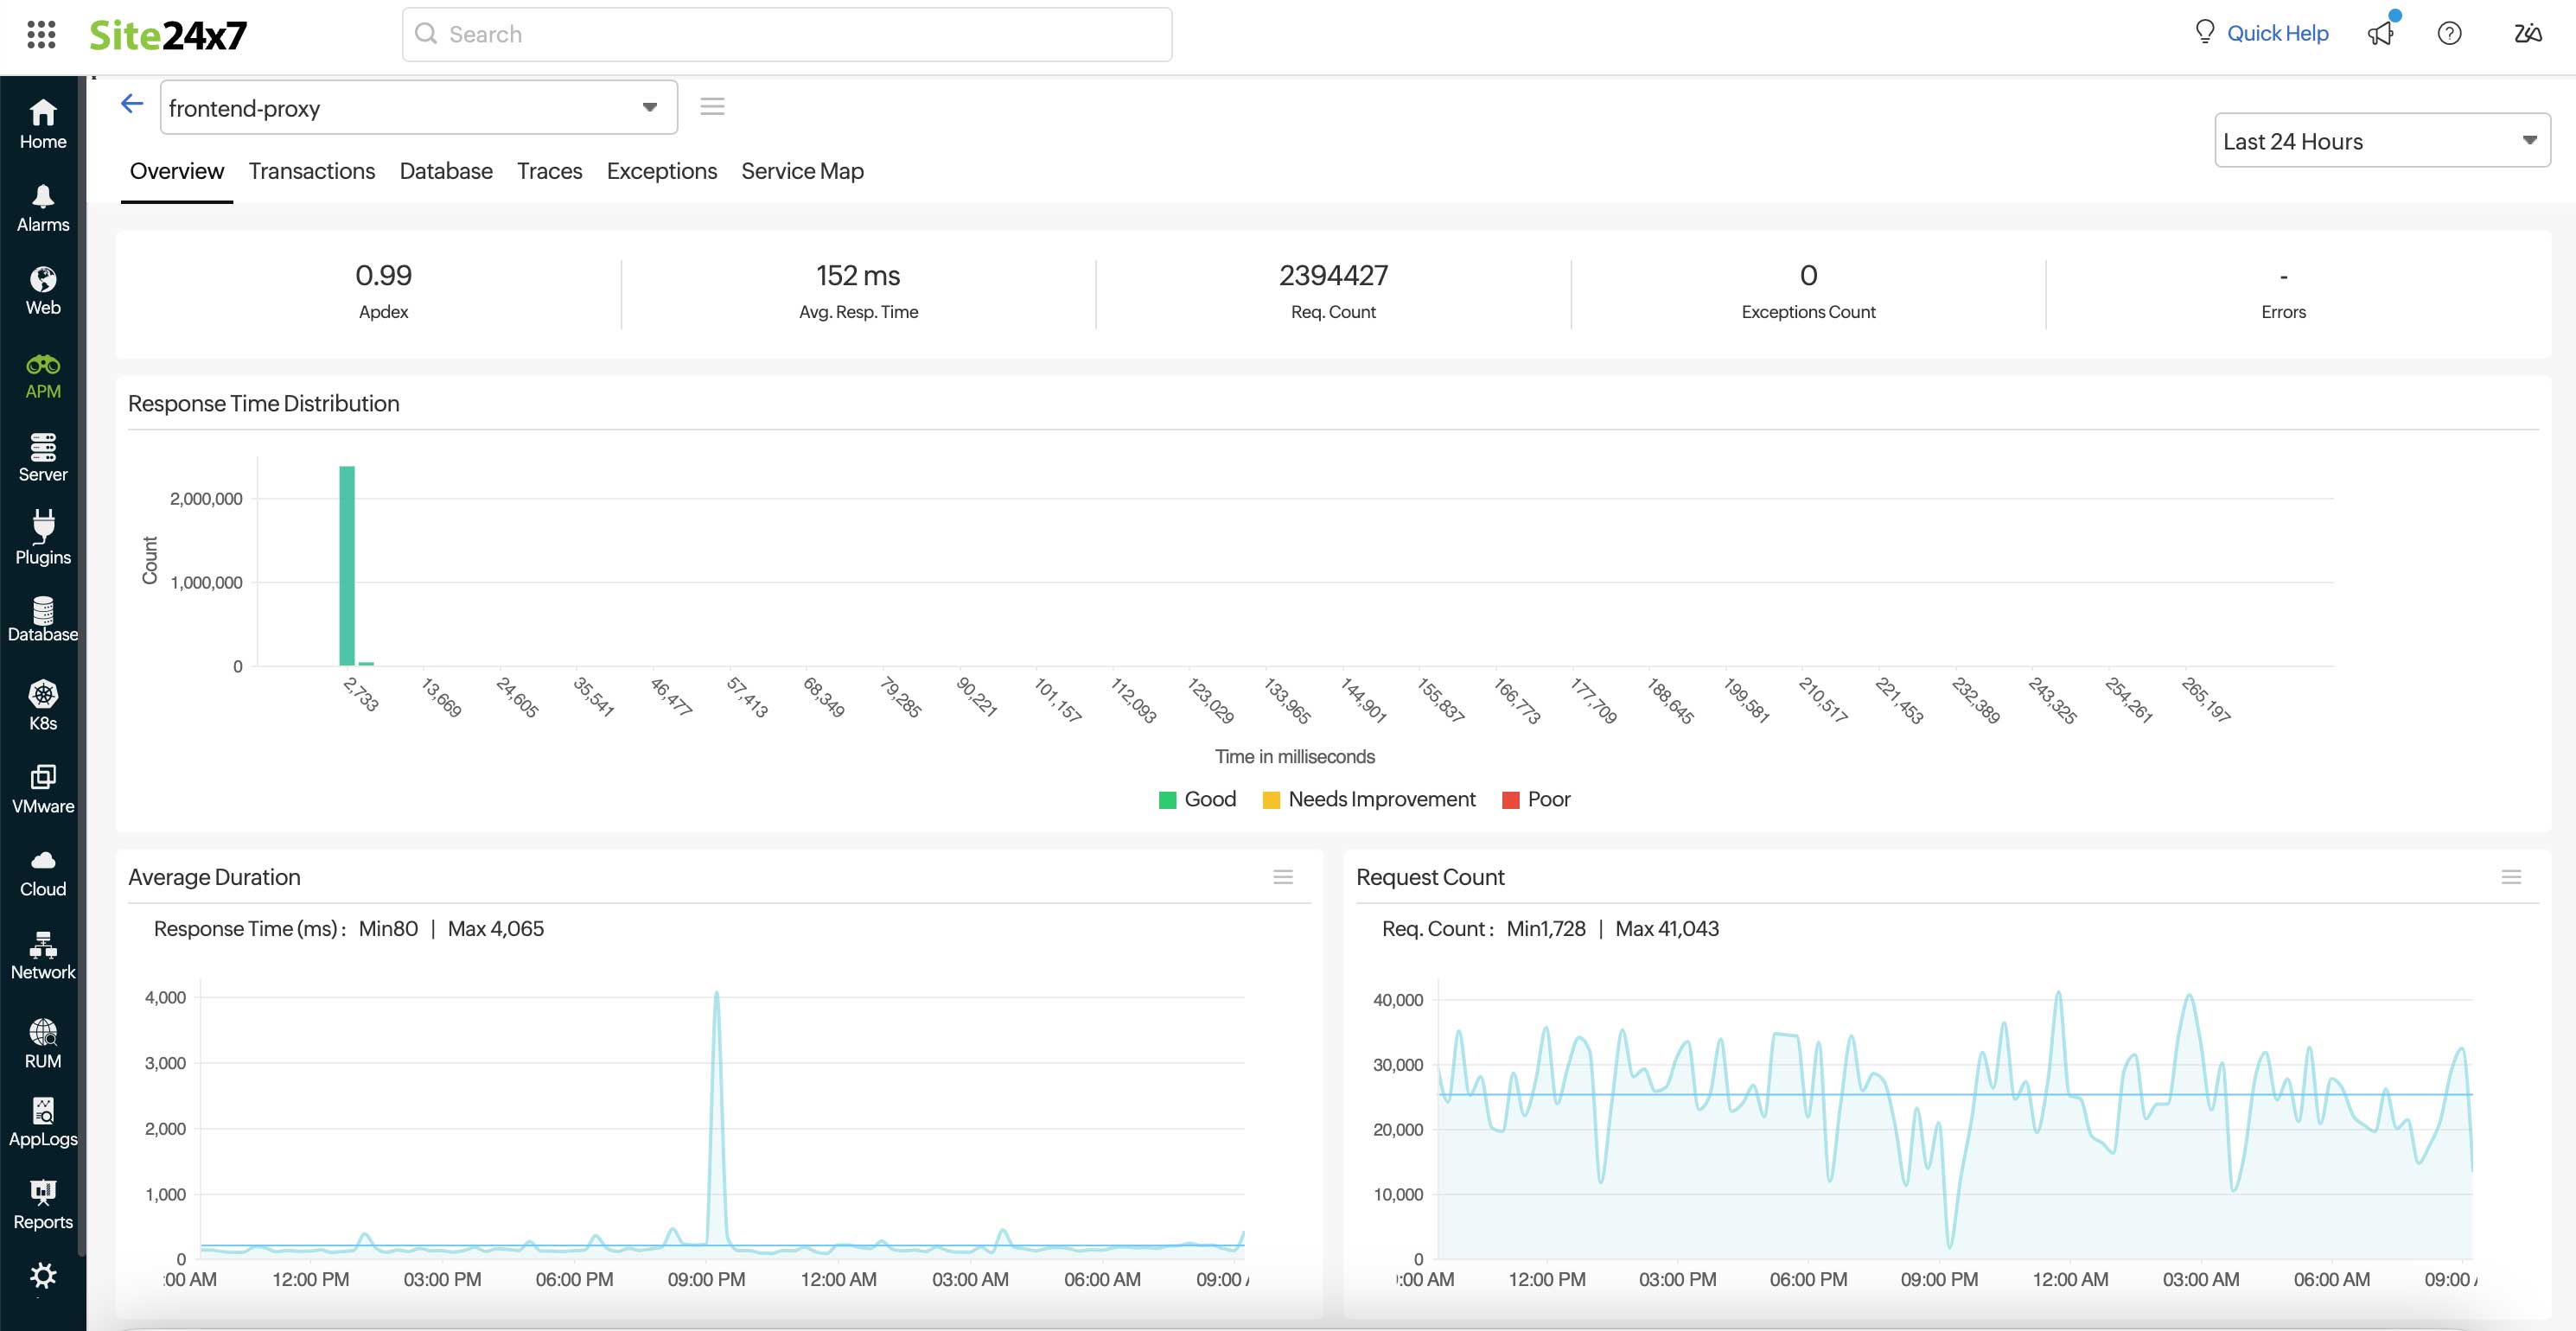
The primary function of this tab is to provide a high-level overview of all the major parameters from an application's point of view.
The top band displays the Apdex score, average response time, request count, exceptions count, and errors.
Transactions
The metrics collected for the various transactions can be visualized in the following views:
Table view
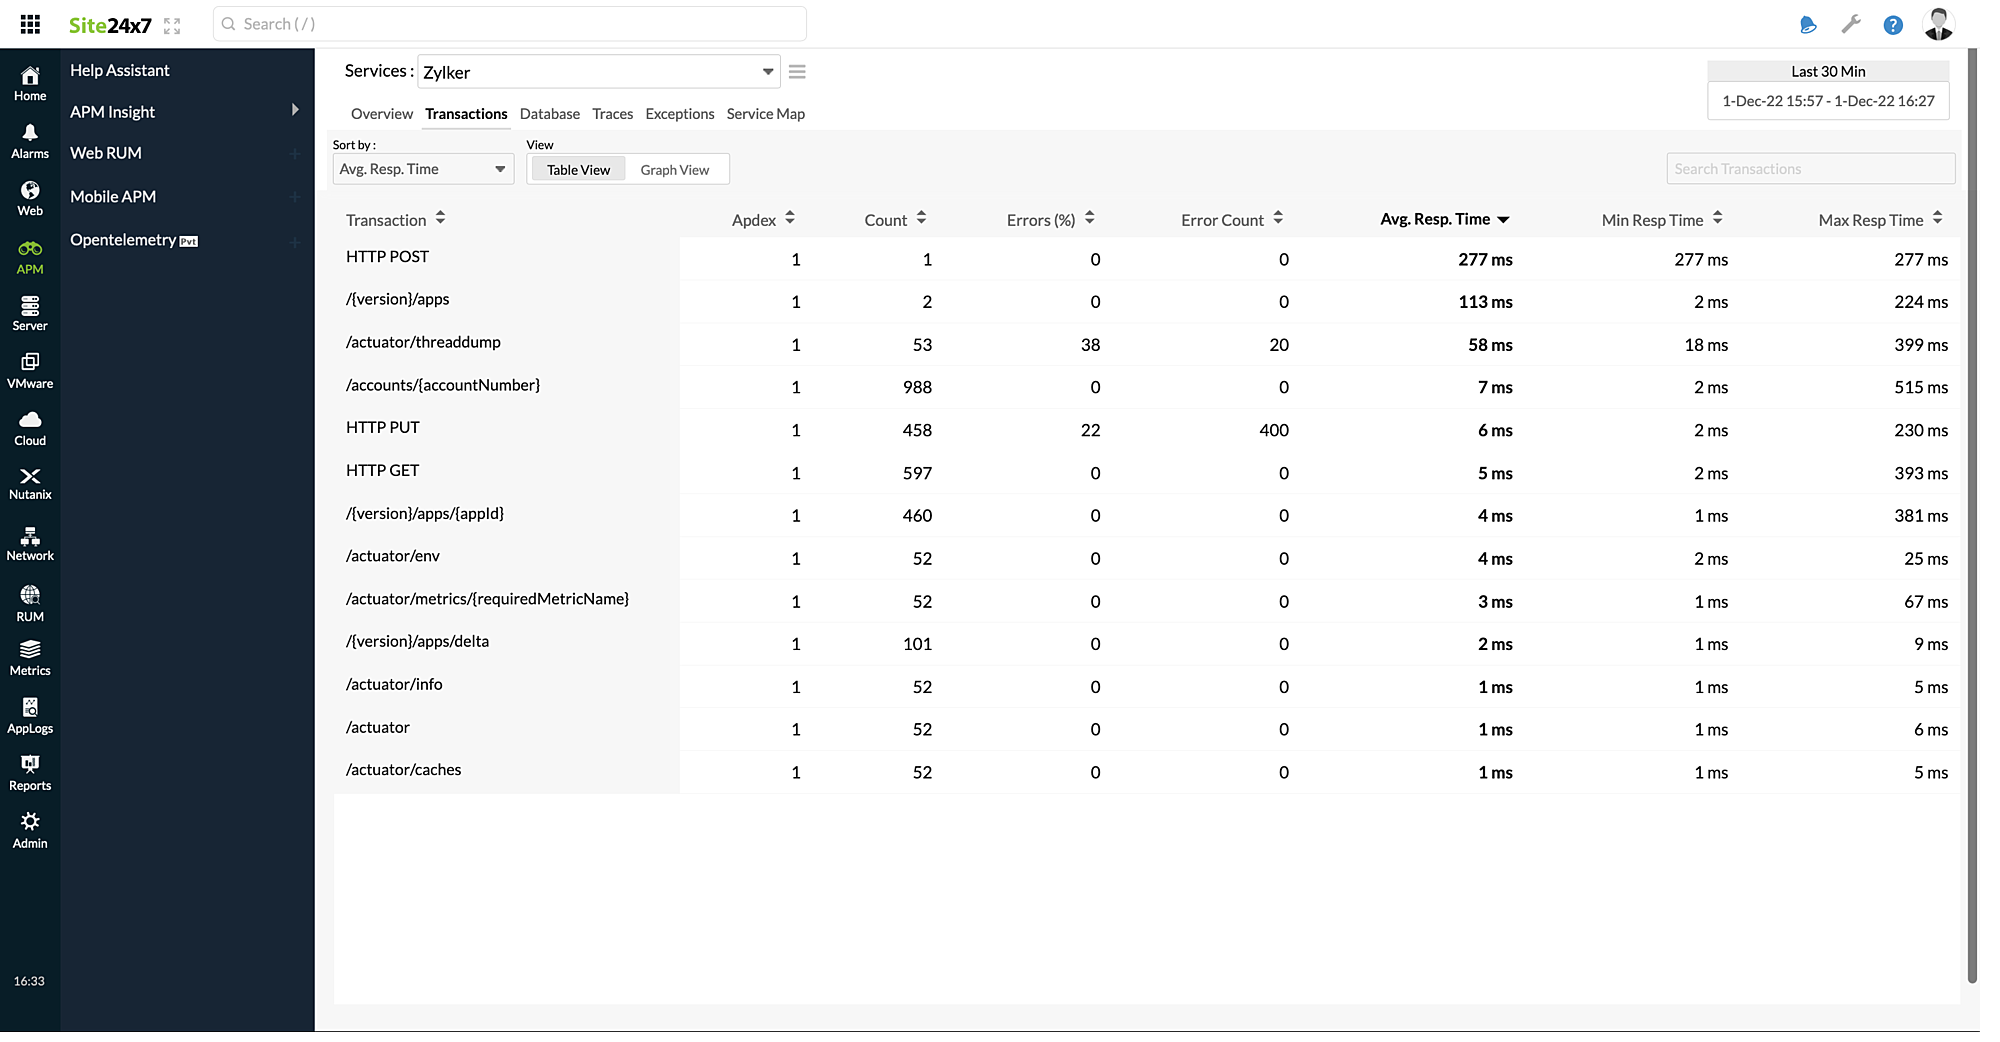
The various transactions running in the application are listed here, along with the associated metrics.
| Parameters | Description |
| Transaction | The name of the transaction. |
| Apdex | A numerical measure of user satisfaction, with 1 representing the highest and 0 representing the lowest. |
| Count | The number of times a user calls a particular transaction. |
| Errors(%) | The percentage of errors that occurs in a particular transaction. |
| Error Count | The total number of errors that occur. |
| Avg. Resp. Time | The average time a particular transaction takes to respond to a user request. |
| Min Resp Time | The lowest amount of time it takes a particular transaction to respond to a user request. |
| Max Resp Time | The highest amount of time it takes a particular transaction to respond to a user request. |
When you click on an individual transaction, you will be taken to the corresponding Graph view.
Graph view
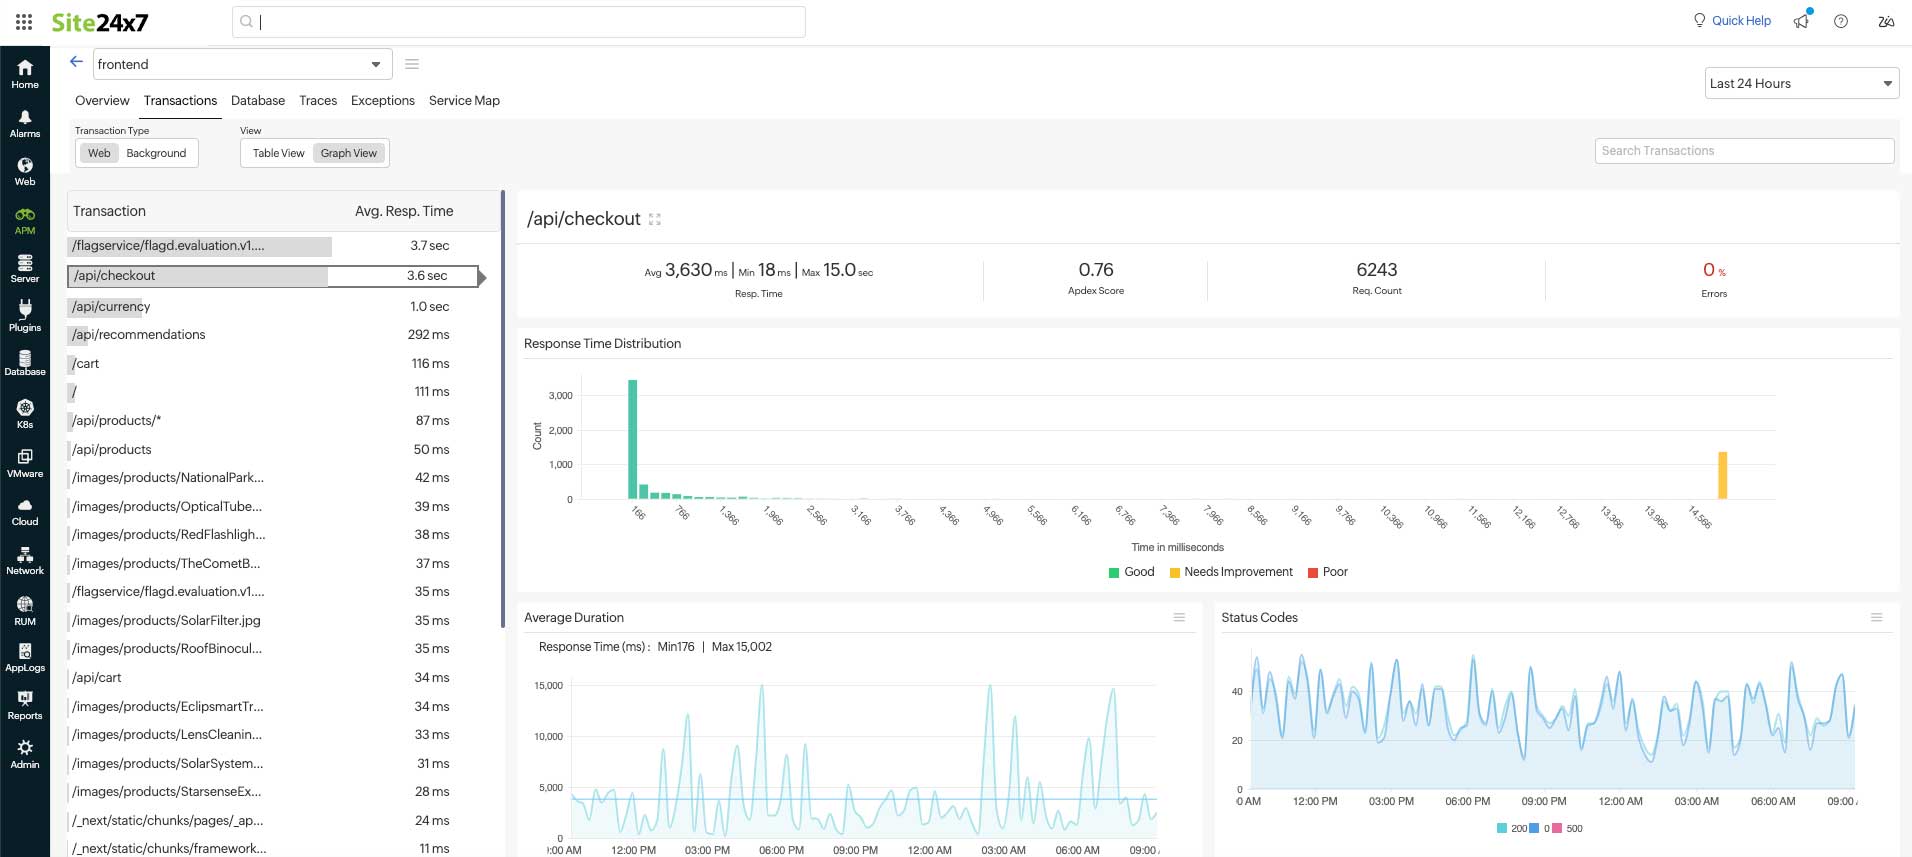
In Graph view, you can inspect additional details about the transactions by clicking on the individual transaction listed on the left panel.
| Parameters | Description |
| Transaction | The name of the transaction. |
| Avg. Resp. Time | The average time a particular transaction takes to respond to a user request. |
The top band displays the response times (average, minimum, and maximum), Apdex score, request count, and errors.
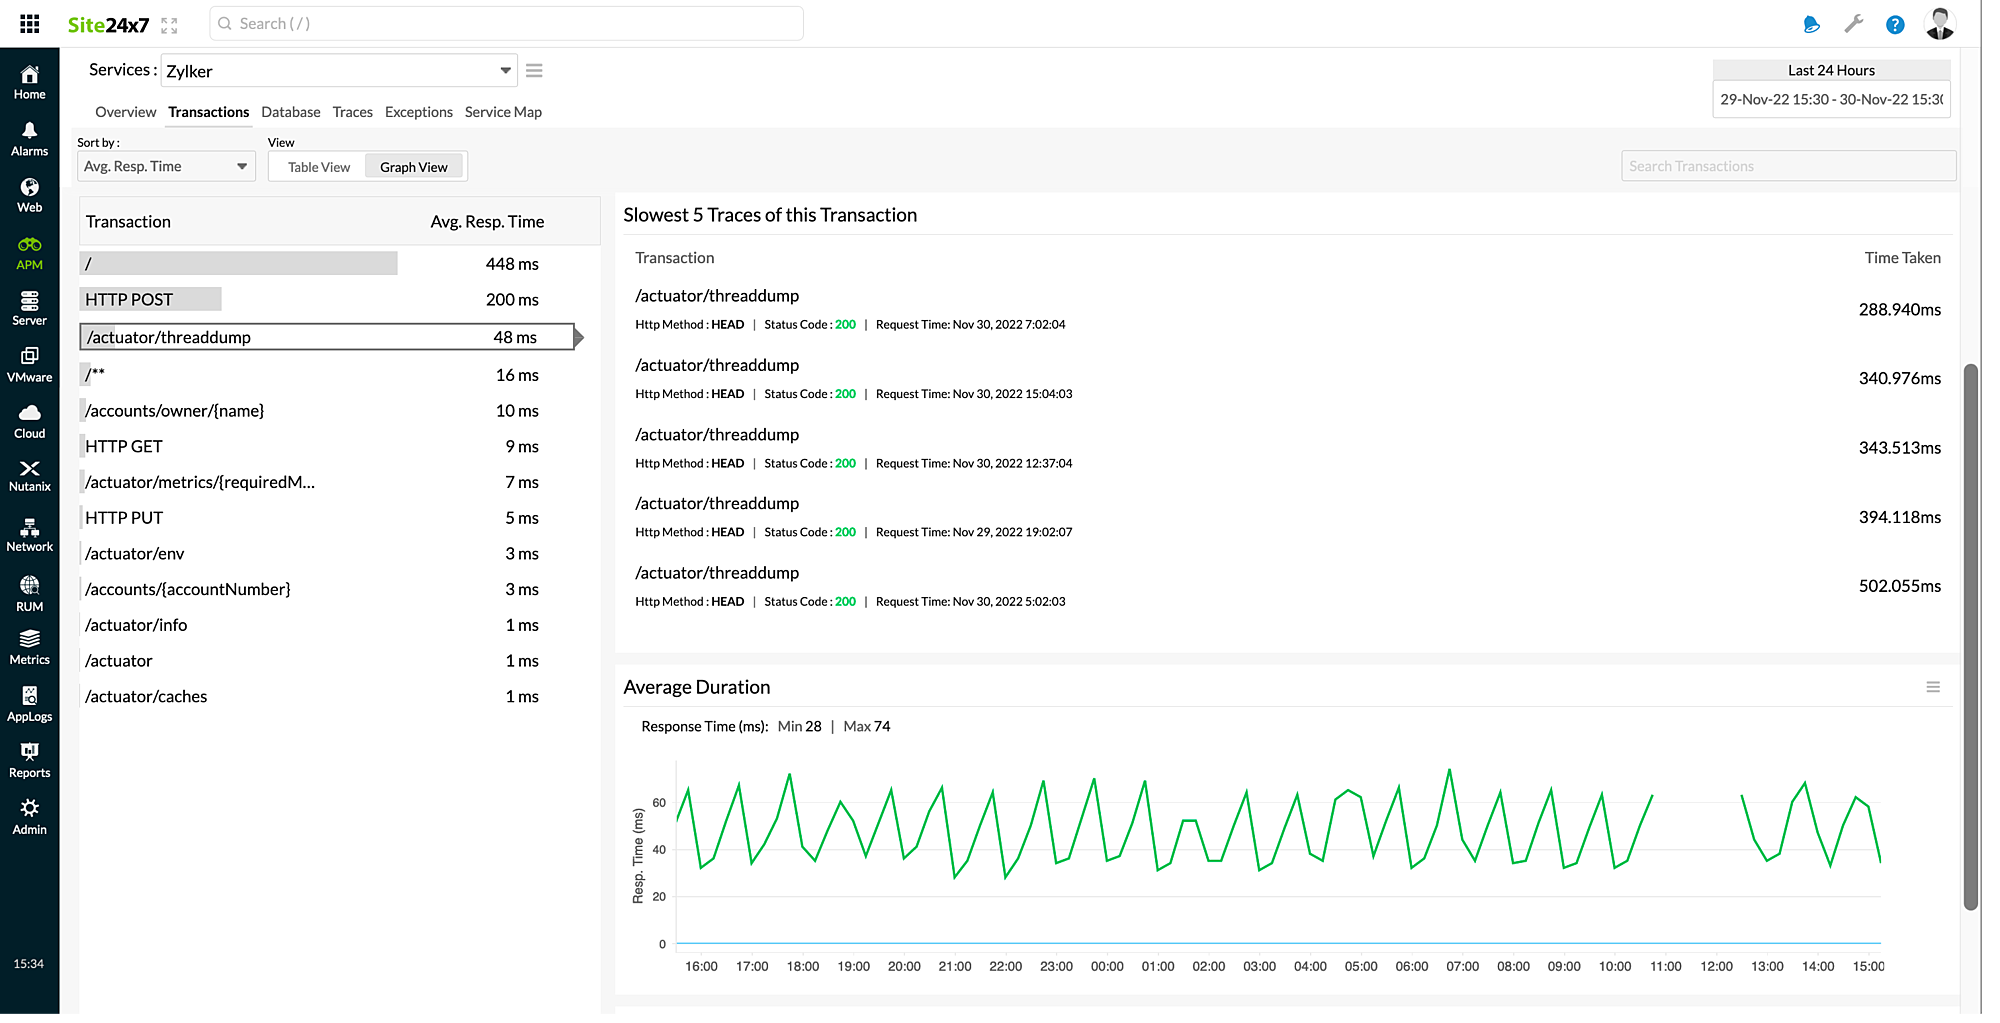
In the sections below, you can also view the most recent five traces and the slowest five traces of this transaction, as well as their corresponding response times.
Average Duration
This graph depicts the response times of the transaction for the timestamps when it is called by the user. The Min is the minimum response time, and the Max is the maximum response time of the transaction.
Database
The metrics collected for the various DB queries can be visualized in the following views:
Table view
The various DB queries executed for the application are listed here, along with the associated metrics.
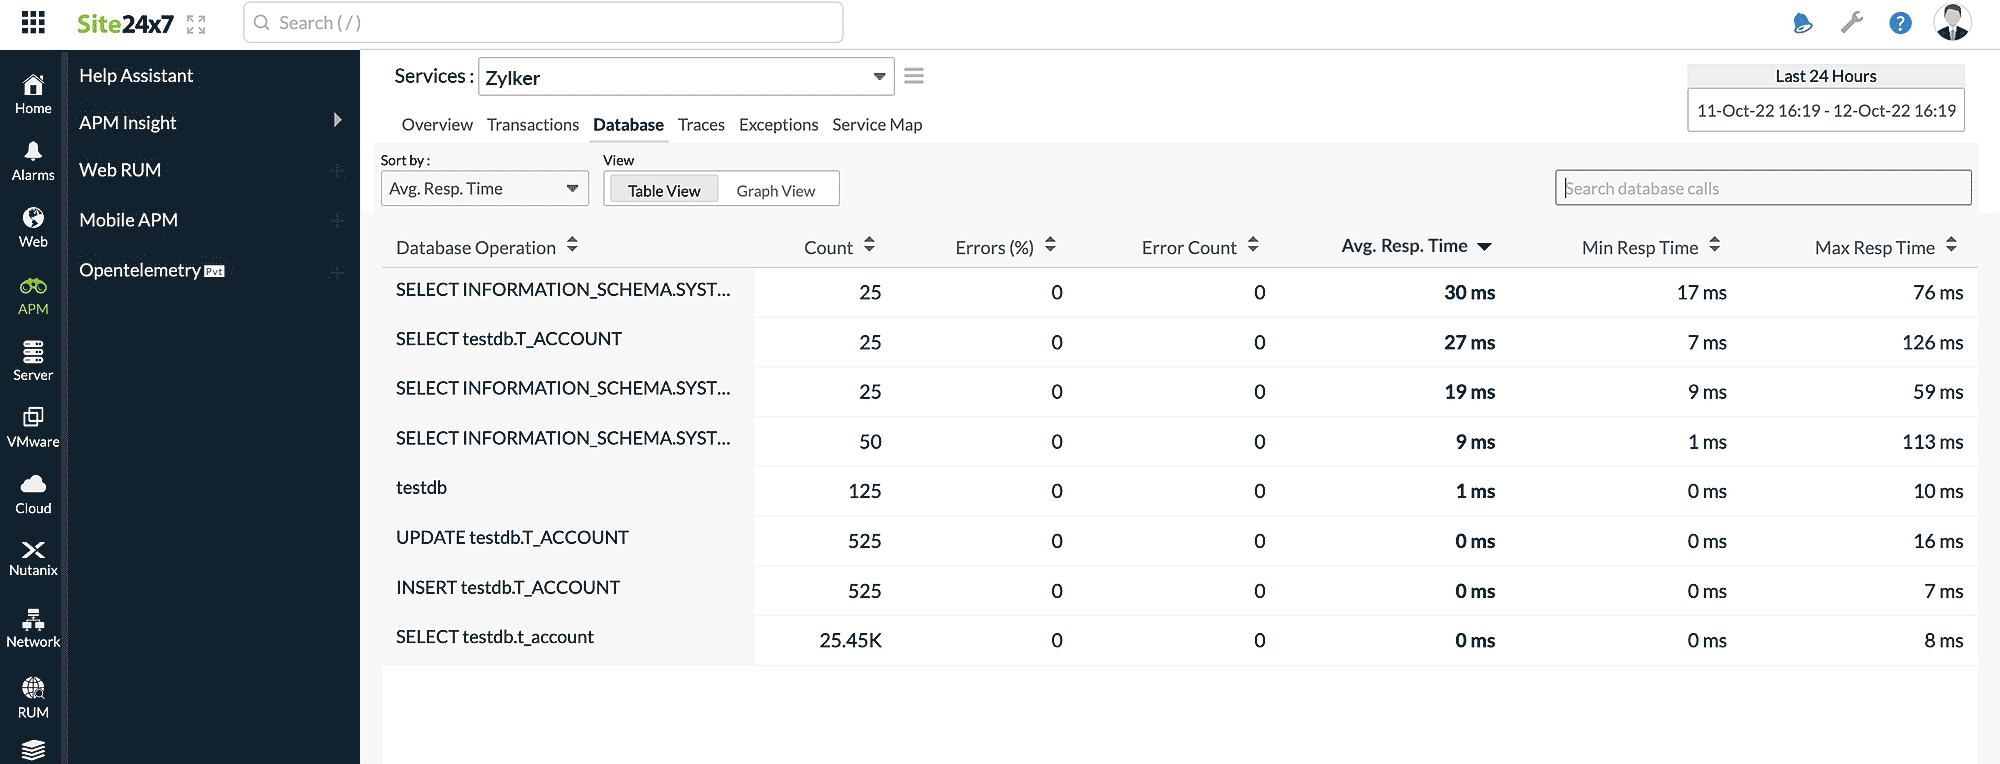
| Parameters | Description |
| Database Operation | The name of the database operation being performed. |
| Count | The number of times a user performs a particular database operation. |
| Errors(%) | The percentage of errors that occurs in a particular database operation. |
| Error Count | The total number of errors that occur. |
| Avg. Resp. Time | The average time a particular database operation takes to respond to a user request. |
| Min Resp Time | The lowest amount of time it takes a database operation to respond to a user request. |
| Max Resp Time | The highest amount of time it takes a particular database operation to respond to a user request. |
Graph view
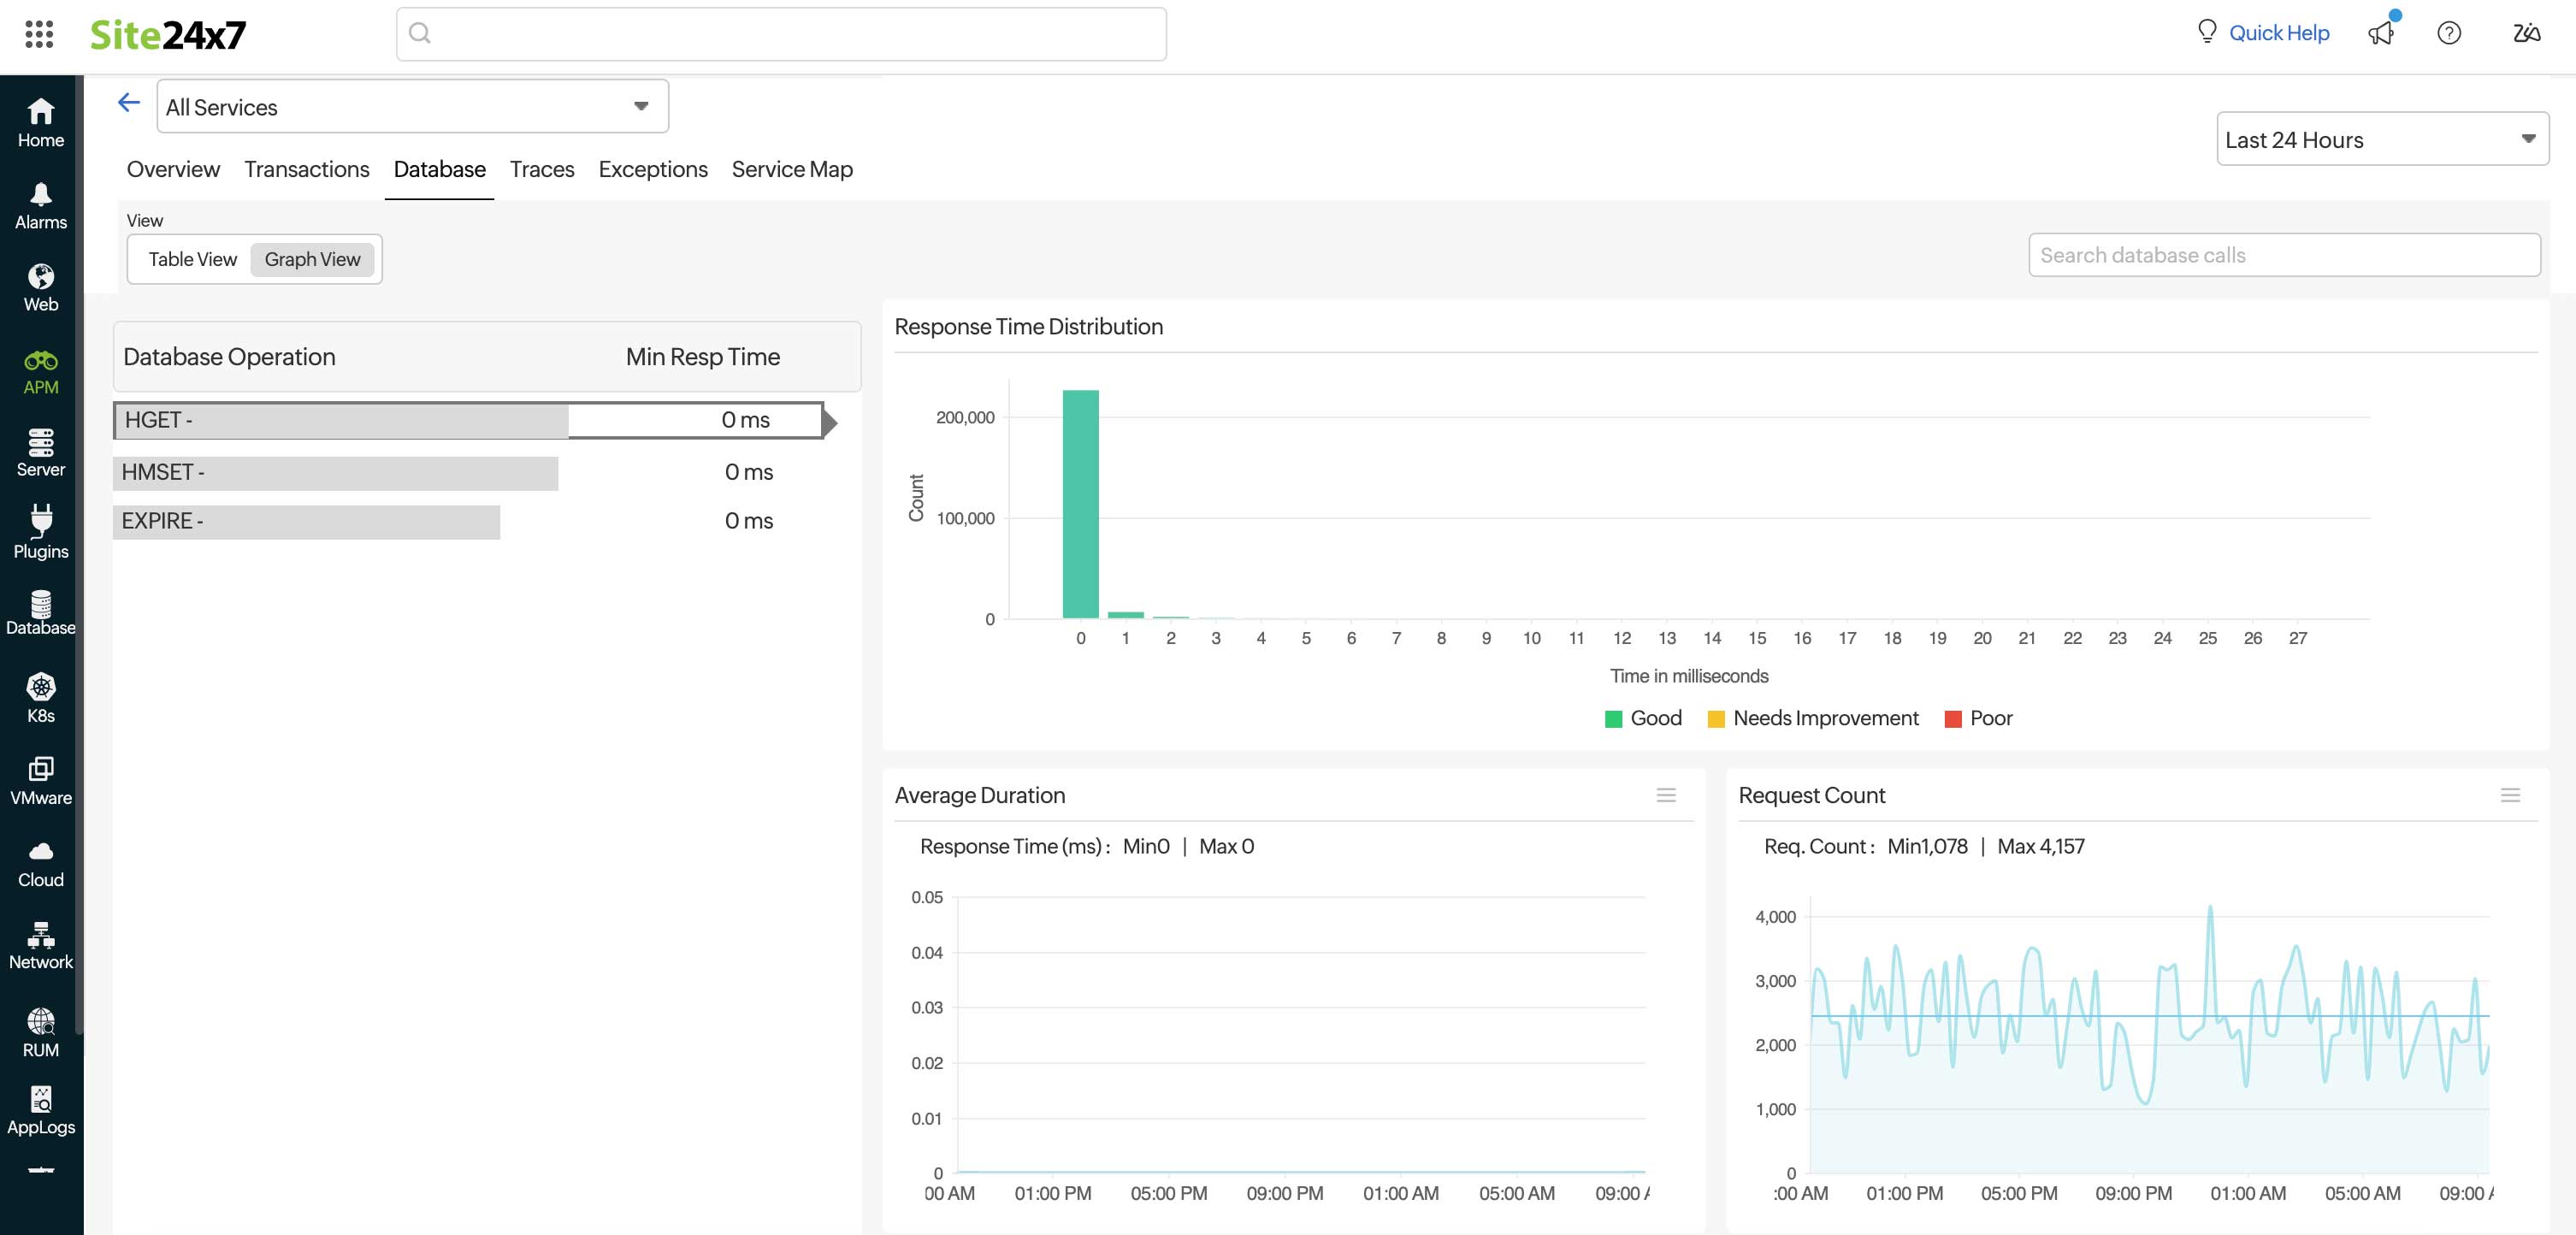
Shows a list of overall Database Operations along with details like average response time, minimum response time, maximum response time, total request count, top five traces, and average duration graph for the selected Database Operation.
Traces
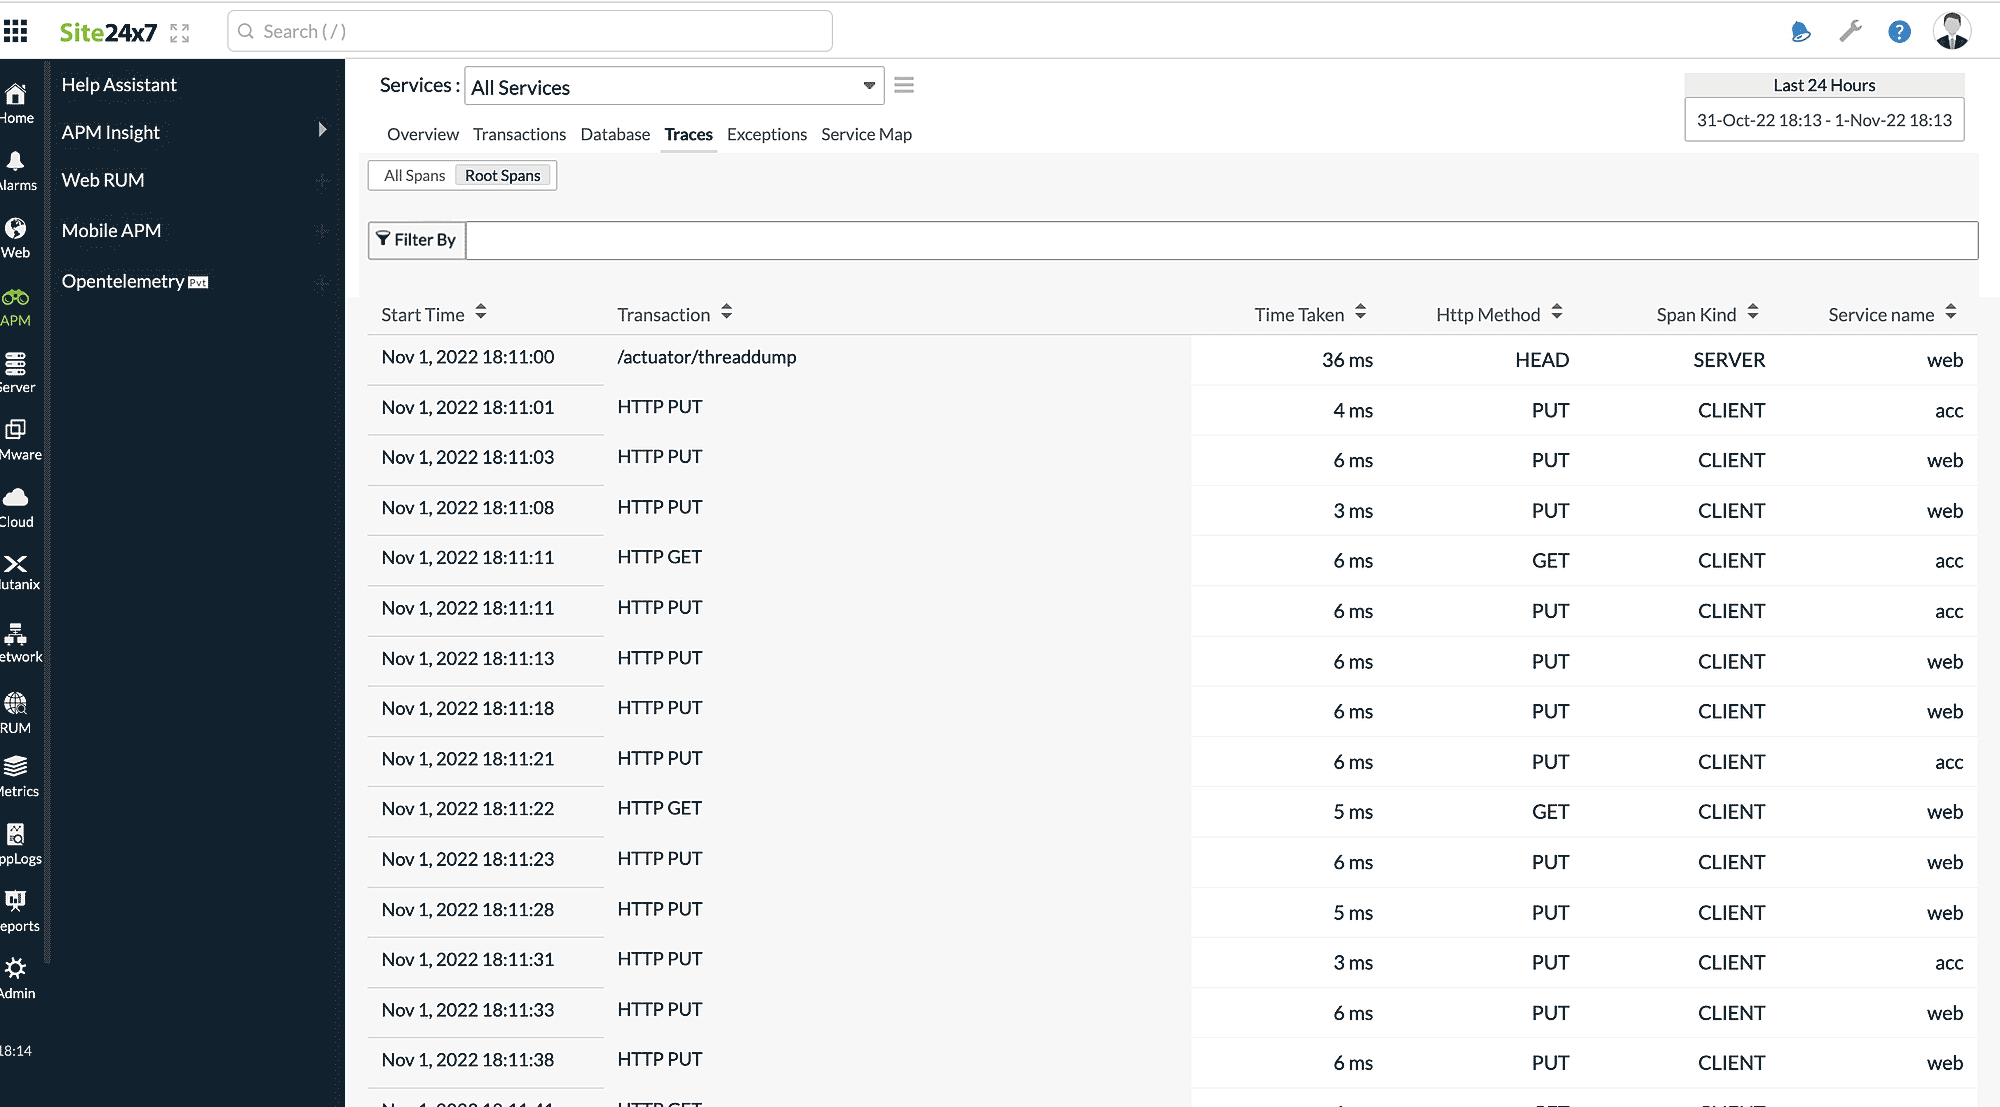
The traces that have been run on various applications and all details pertaining to them are listed in this section.
The Traces tab offers two separate views; you can pick the respective toggle button to view the listed spans.
- All Spans: You can view all the spans (child and parent).
- Root Spans: This view allows you to view only the root (parent) spans.
| Parameters | Description |
| Start Time | Detailed start date and time when the trace was launched. |
| Transaction | The name of the transaction. |
| Time Taken | The amount of time it takes a particular trace to respond to a user request. |
| Http Method | The type of HTTP method used. |
| Service name | The name of the service. |
| Span kind | Gives the relationships between spans in addition to the parent and child relationship. |
Check out this table to learn about the various types of Spans.
| Type | Description |
| CLIENT | Indicates that the span covers the client-side wrapper around an RPC (Remote Procedure Call) or other remote request. |
| CONSUMER | Indicates that the span describes a consumer receiving a message from a broker. |
| INTERNAL | Default value. |
| PRODUCER | Indicates that the span describes the producer sending a message to a broker. |
| SERVER | Indicates that the span covers server-side handling of an RPC (Remote Procedure Call) or other remote request. |
Filter By
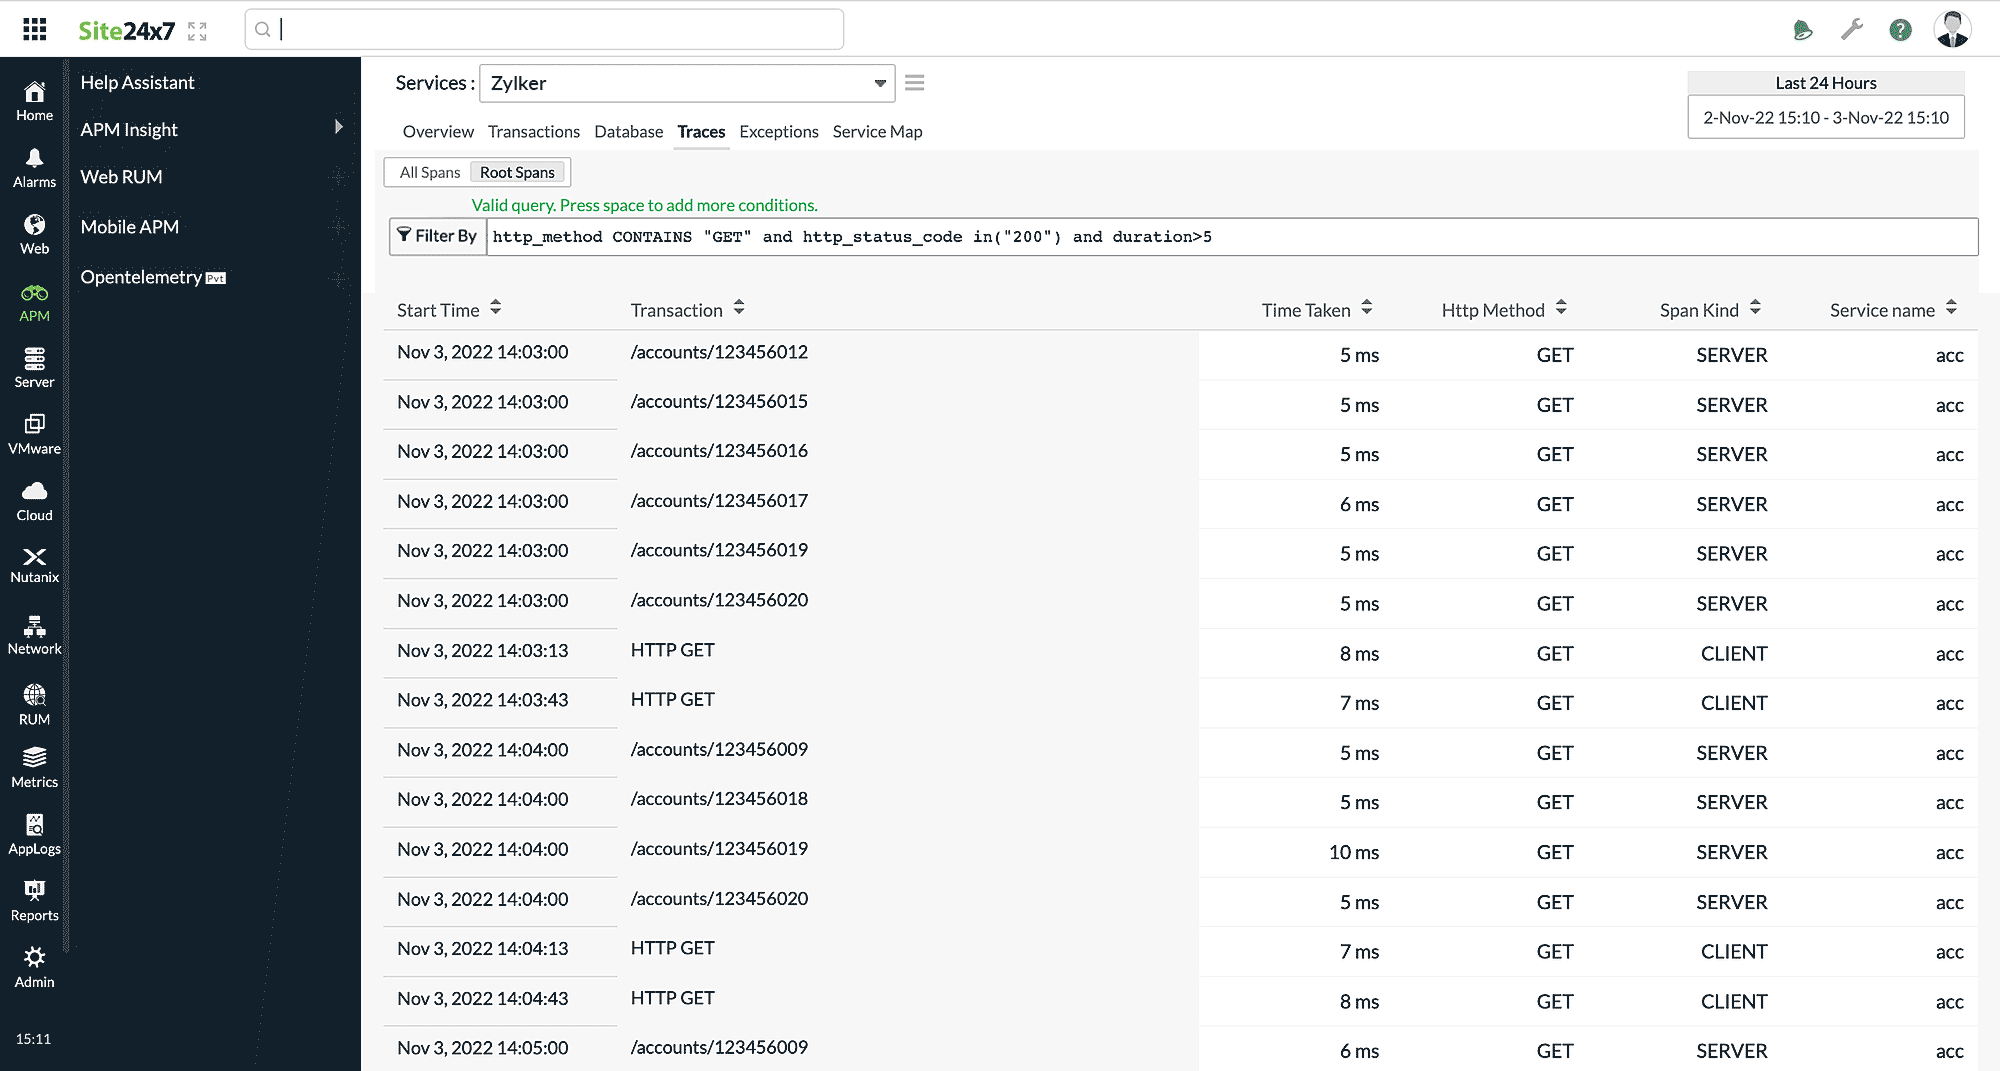
You can quickly search based on any parameters by entering the required query in the provided Filter By box. You can use space to add more conditions like AND, DISTINCT, OR, and NOT. All the conditions will be applied during the filtration process, so only traces that satisfy these conditions will be displayed.
For example, in the image below, the search criteria have three conditions—HTTP method contains GET, HTTP status code is 200, and duration is above 5 (ms).
You can view the whole picture of the required trace by clicking directly on it.
In this view, you can inspect additional details about the traces by clicking on the individual traces listed on the left panel.
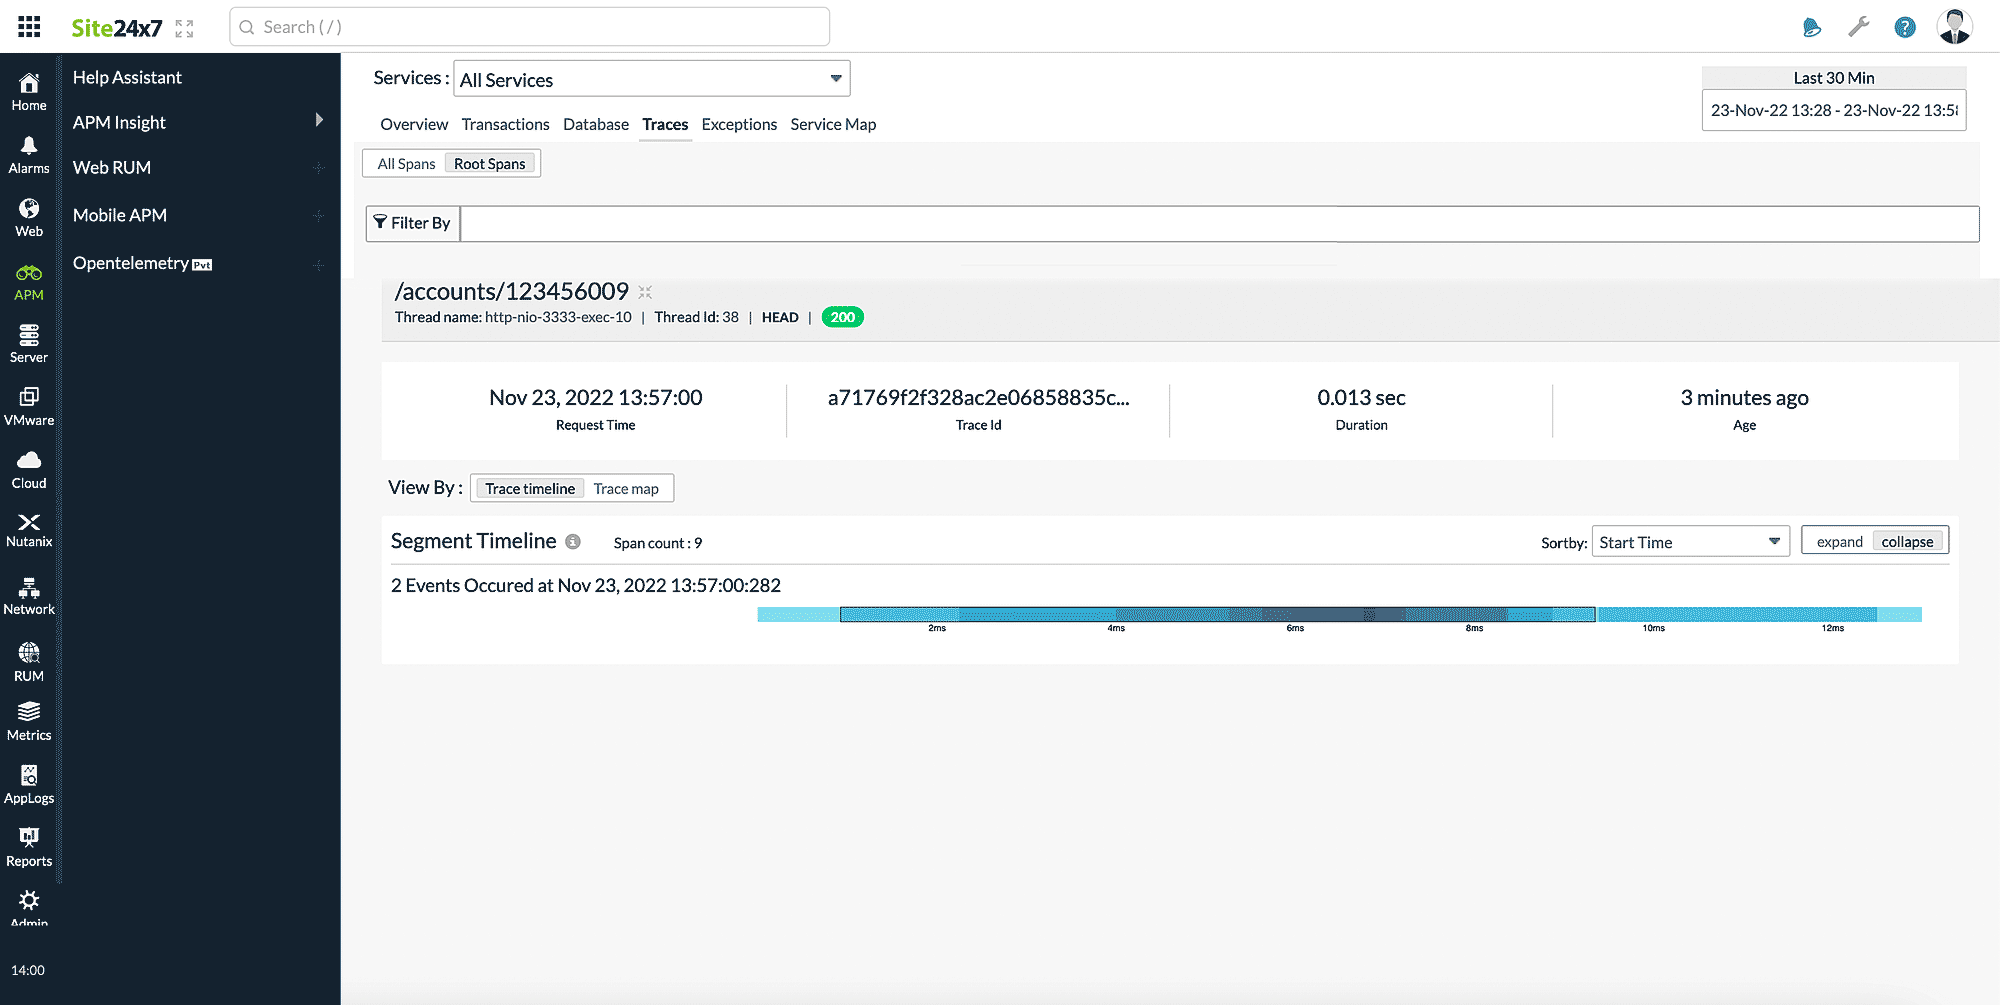
The top band displays the trace name, thread name, thread ID, HTTP method, and HTTP response code.
In the next section, you can also view the other details like Request Time, Trace Id, Duration of the trace, and Age.
The final section provides two distinct views; select the appropriate toggle button to view the Trace timeline or Trace map.
Trace timeline:
- The trace timeline shows an overview of all the spans your application called before responding to a request. Each line represents a span.
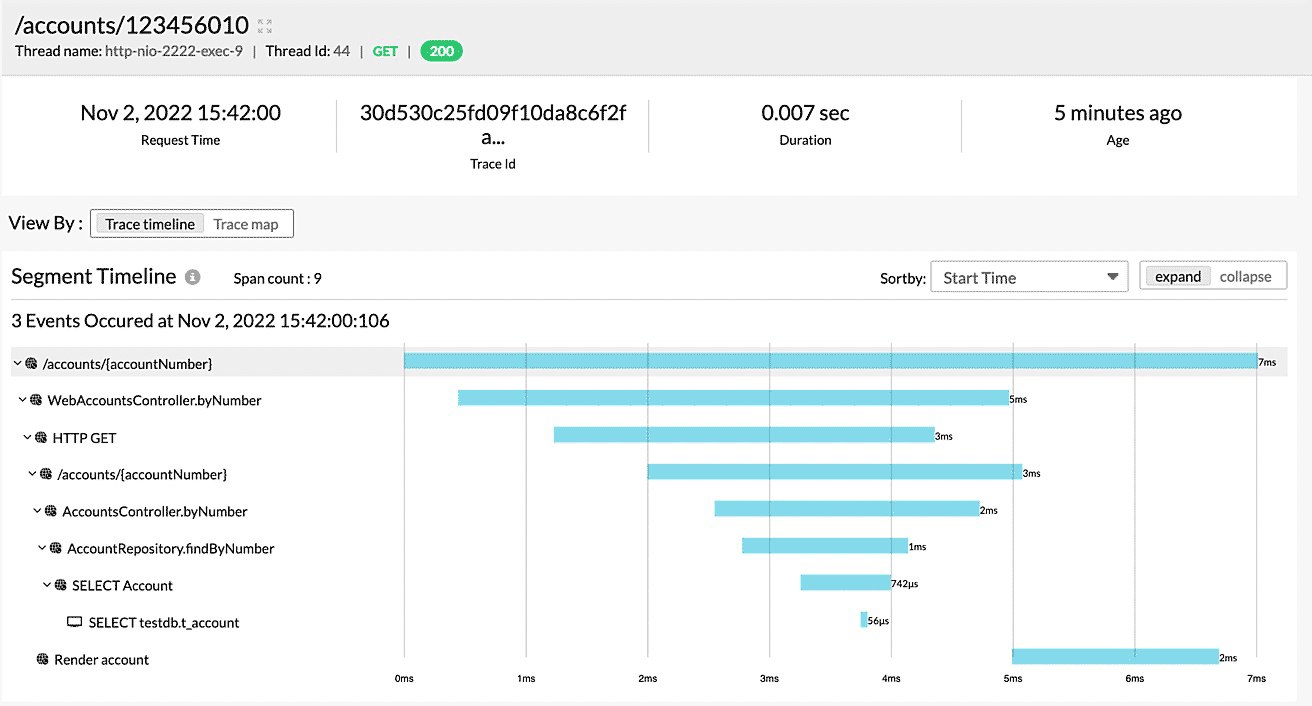
- You can sort your monitors by Start Time, Slowest span, or Response Time using the Sort By drop-down at the top of the Segment Timeline section.
- The spans can be further drilled down by clicking on the timeline bar.

Trace map:
Trace map gives you a complete overview of your application infrastructure and its connection to other dependent resources.
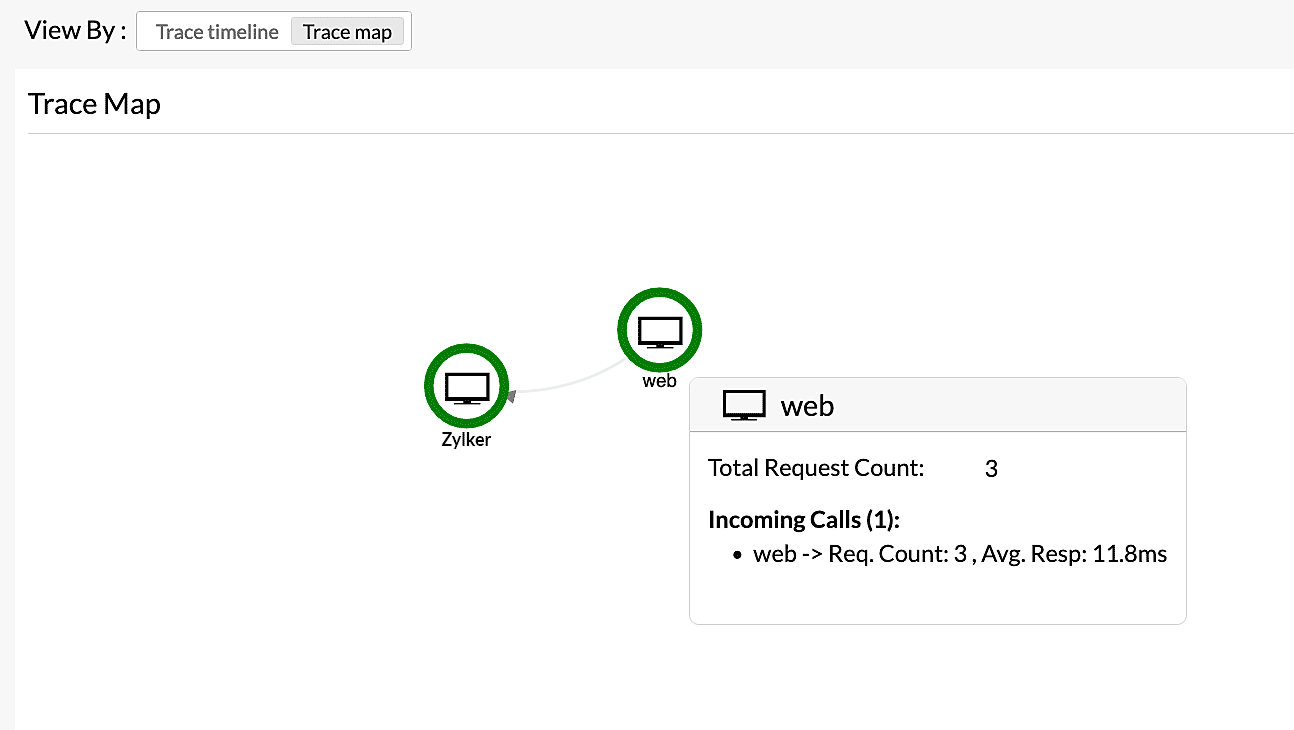
- The applications and services are represented as nodes.
- When your application or service requests another application or service, it is indicated by a dotted arrow line.
You can view the metrics of each node by hovering the mouse over it.
| Parameters | Description |
| Total Request Count | The total number of requests received from other applications. |
| Request Count | The total number of requests from the mentioned application. |
| Avg. Resp | The average time it takes to respond to requests from the mentioned application. Note
The average response time is also displayed above the dotted arrow line. |
Exceptions
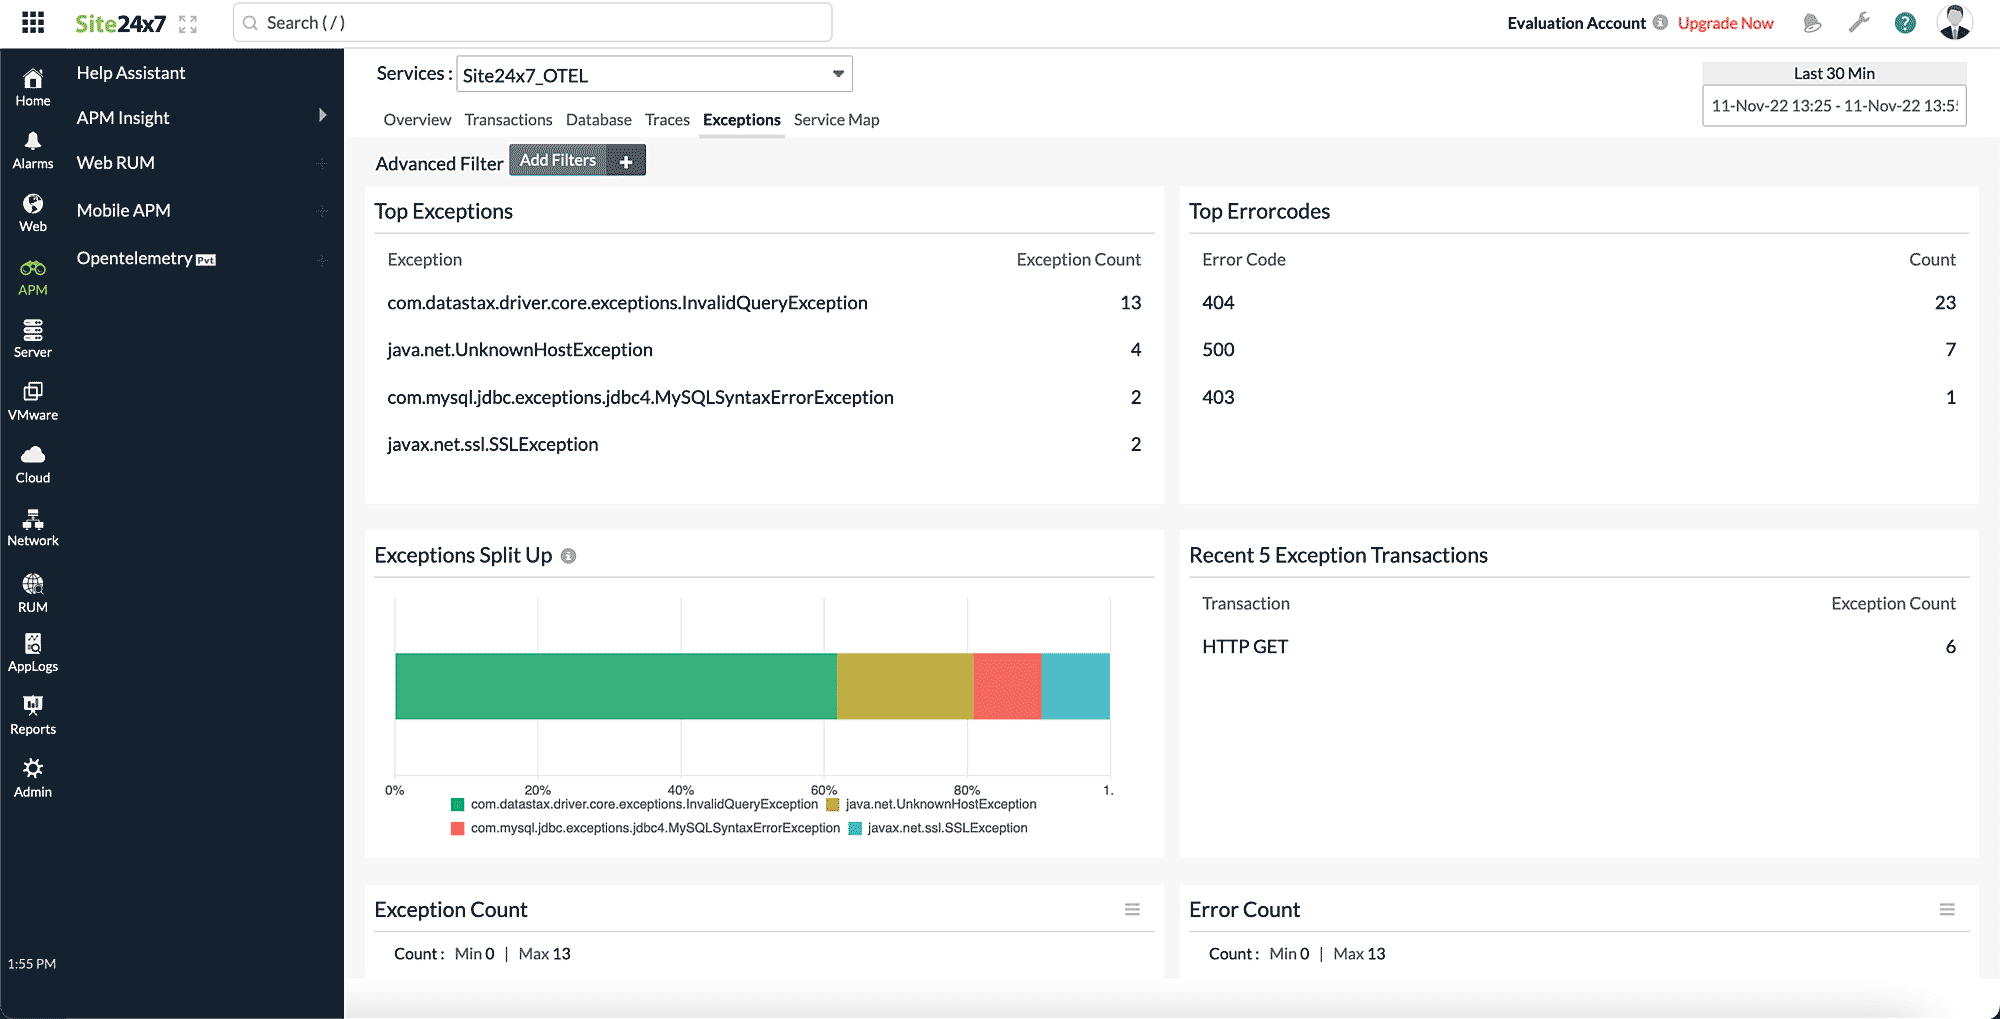
The Exceptions tab makes it easy to drill down on exceptions to a granular level. It gives an overall summary on the exceptions and errors with information on the list of Top exceptions, list of top error codes, and five recent exceptions transactions.
Exceptions Split Up widget records all the exceptions of your selected application for a selected time range. You can identify and decode various exceptions from the past. Each exception is color coded in a separate color for easy identification. Exceptions can also be drilled down to extract maximum data and facilitate easy troubleshooting.
Also, you will receive a graphical view displaying the Exception Count and Error Count. It gives you a description of all the exceptions and errors that have occurred, along with a count of how many times they have taken place.
The final section provides a list of error traces and all details pertaining to them.
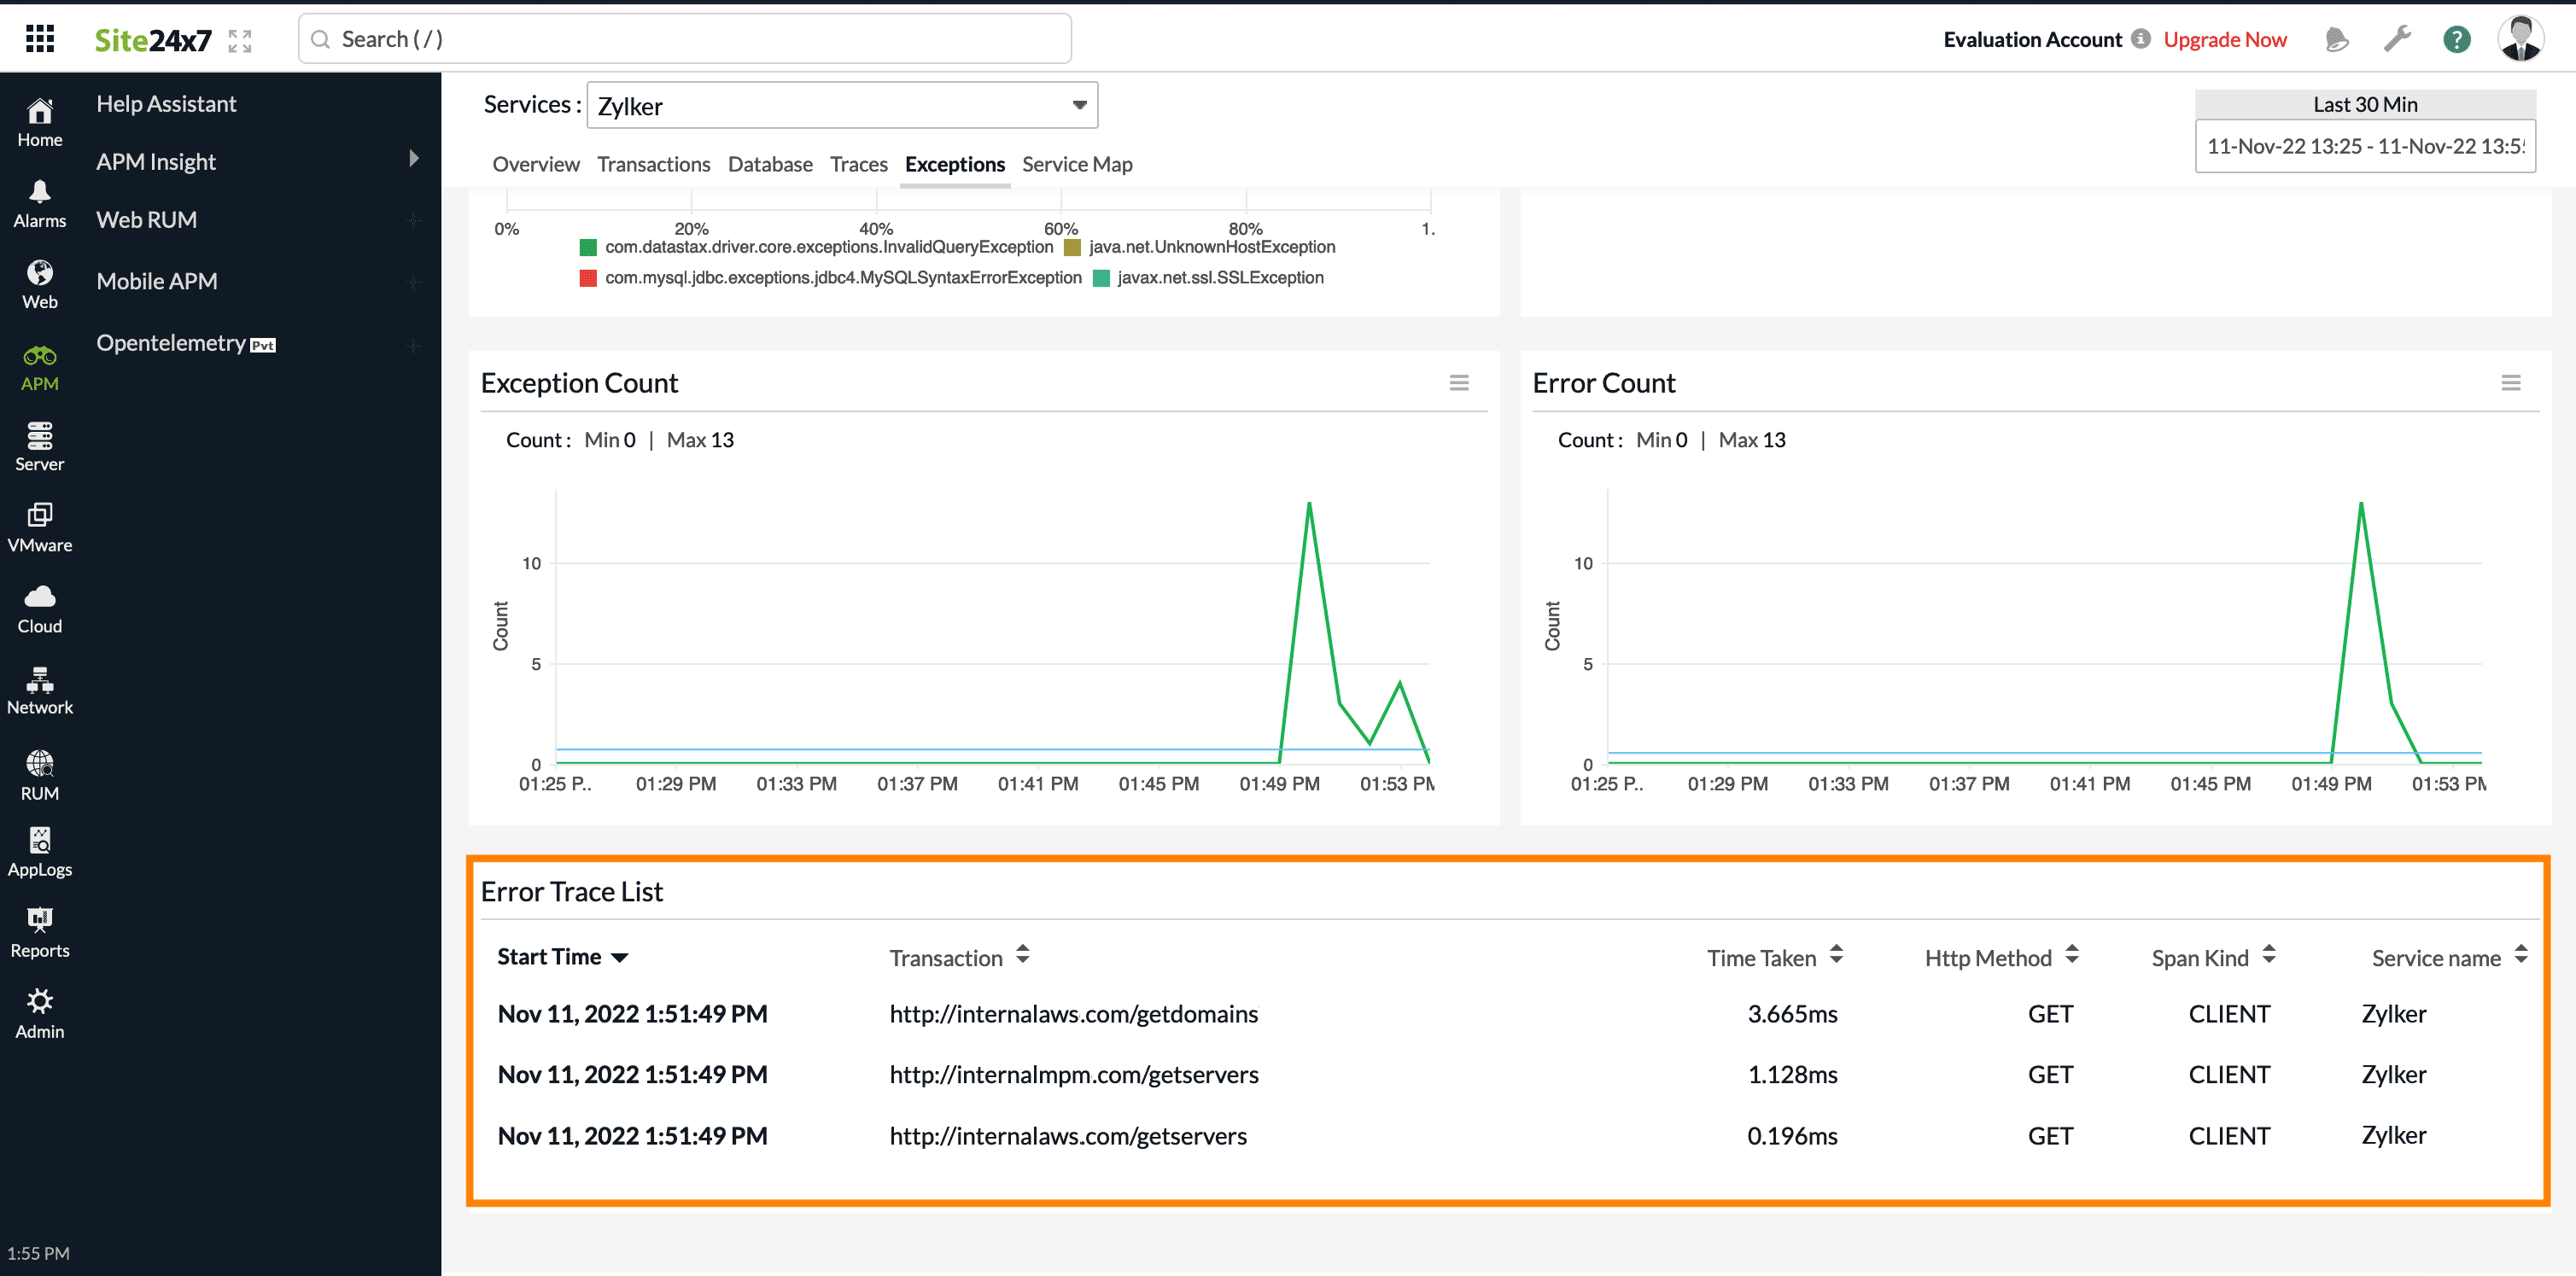
| Parameters | Description |
| Start Time | Detailed start date and time when the trace was launched. |
| Transaction | The name of the transaction. |
| Time Taken | The amount of time it takes a particular trace to respond to a user request. |
| Http Method | The type of HTTP method used. |
| Service name | The name of the service. |
| Span kind | Gives the relationships between spans in addition to the parent and child relationship. |
Advanced Filter
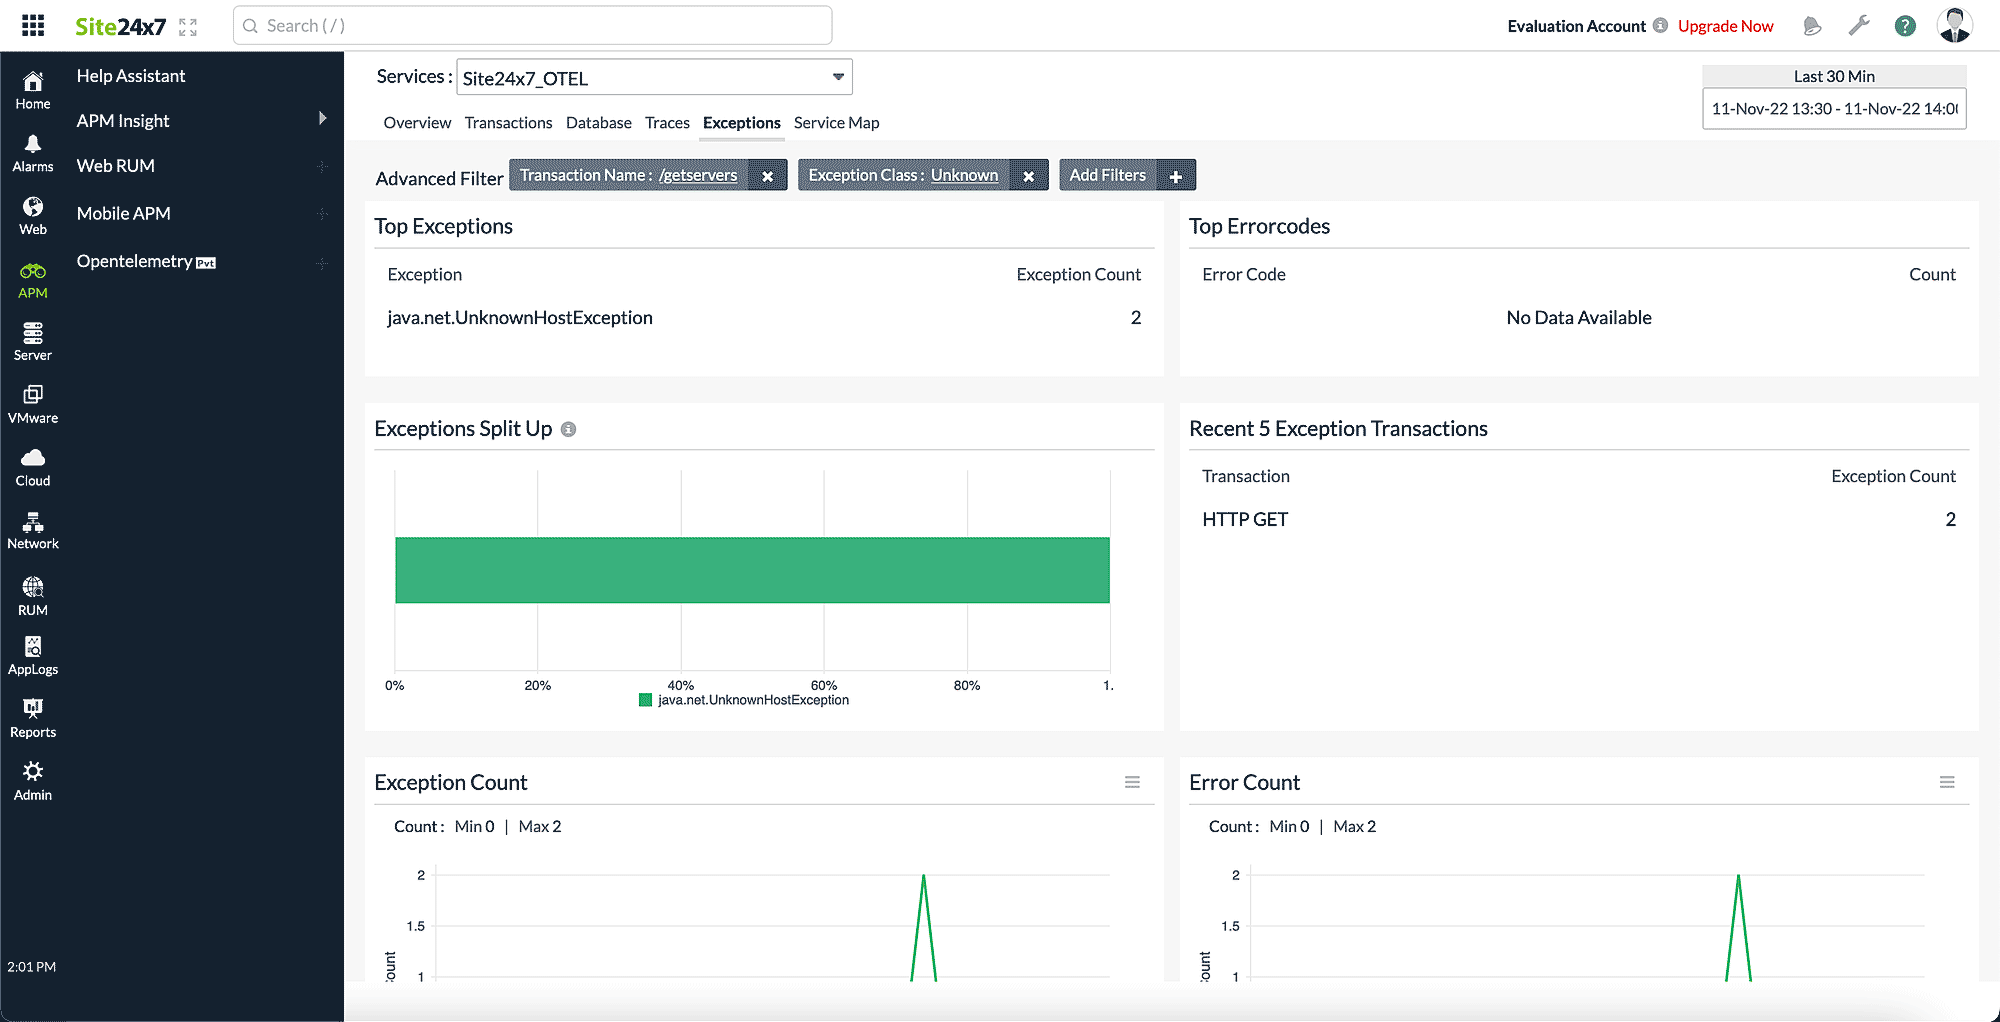
The Advanced Filter option has built-in AND conditions, allowing you to specify unlimited search conditions. During the filtration process, the AND conditions will be implemented, meaning only traces concurring with all of these conditions will be displayed.
You can click on the Add Filters option to select the required field type, be it Transaction Name, Exception Class, and Error Code. The field values will be listed based on the field type selected.
You can add multiple filters one by one. Each filter added will be considered as an AND condition.
The defined filter value in the Filter drop-down will also be included in the AND condition.
For example, in the image below, the search criteria have three conditions—Transaction Name as /getservers and Exception Class as Unknown.
Service Map
Service Map gives you a complete overview of your application infrastructure along with its connections to other dependent resources.
- The applications and services are represented as nodes.
- When one application or service makes a request to another application or service, it is indicated by a dotted arrow line.
You can view the metrics of each node by hovering the mouse over it and when you click on an individual node, you will be displayed with a list of transactions and the corresponding average response time and request count.
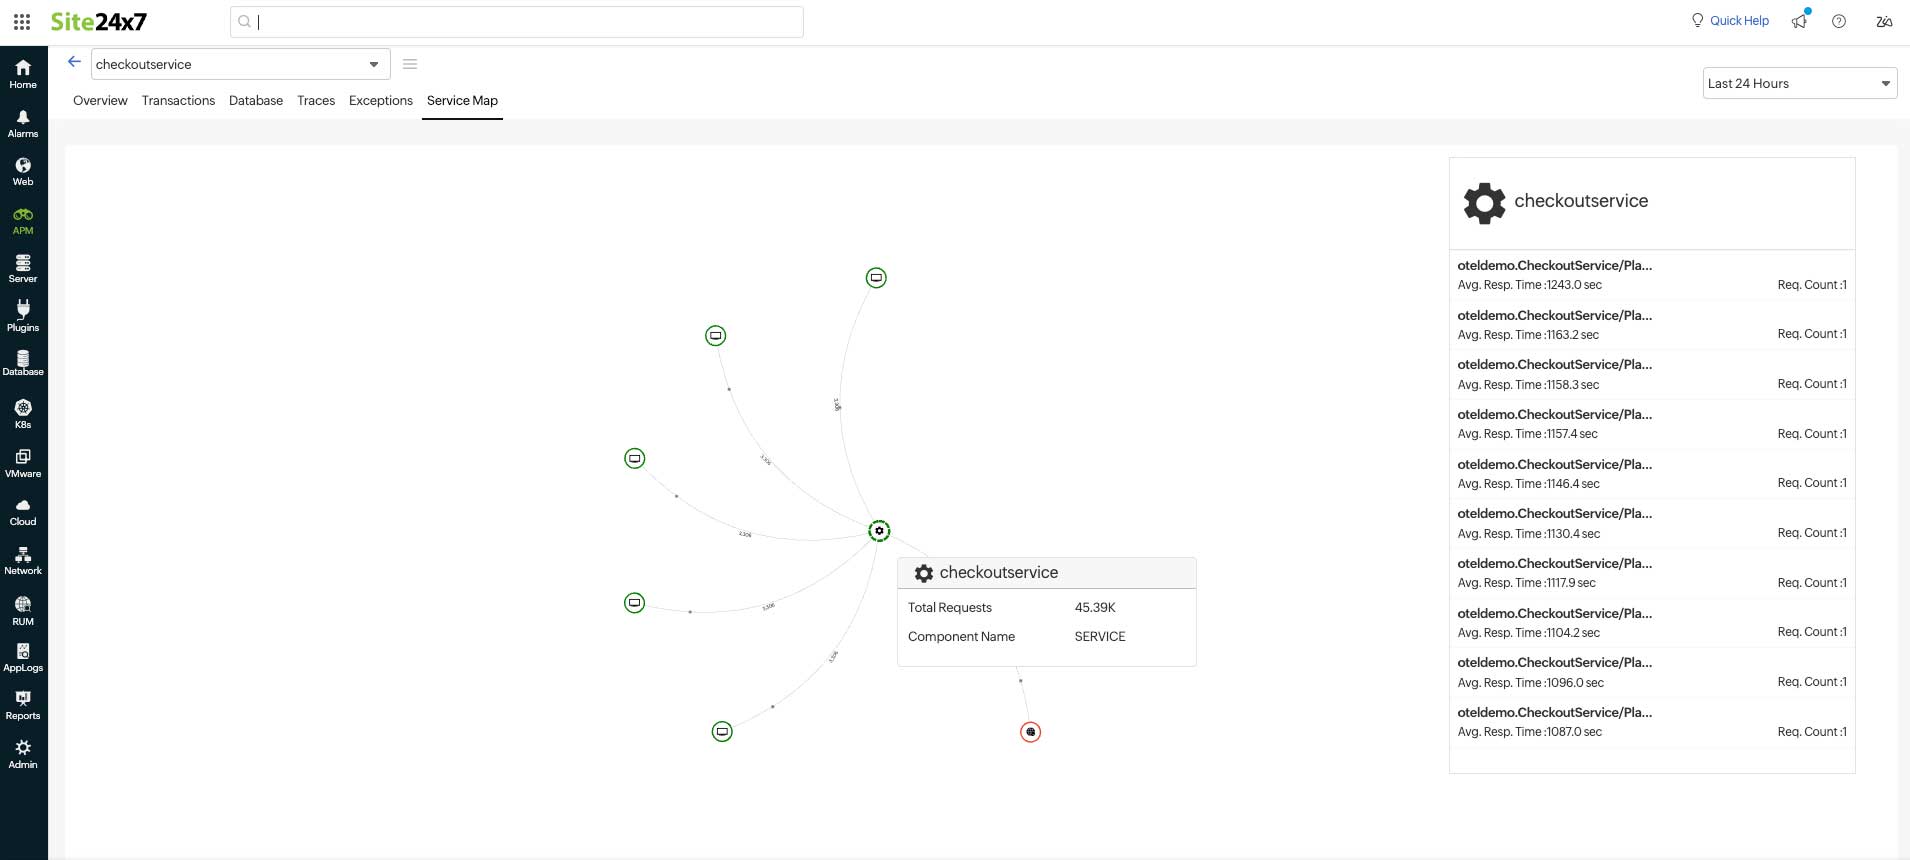
When you click on an individual transaction, you will be taken to the corresponding details in the Traces tab.
You can fine-tune your application monitoring by modifying the OpenTelemetry configuration profile.
-
On this page
- Overview
- Transactions
- Database
- Traces
- Exceptions
- Service Map
