Understanding Integration of APM Insight and Servers
Server Monitoring allows you to keep track of and measure important metrics of your server like Availability, CPU, Memory, Disk Utilization, Processes, Operating System, and more. You can get a complete picture of your application's performance along with the metrics of the connected servers by integrating the server monitors with your application.
For an in-depth understanding of Server Monitoring, check out our Server Monitoring page.
- Automatic integration
- Server Metrics dashboard
- Service Map
- Traces
- Major benefits of integrating APM Insight with your servers
Automatic integration
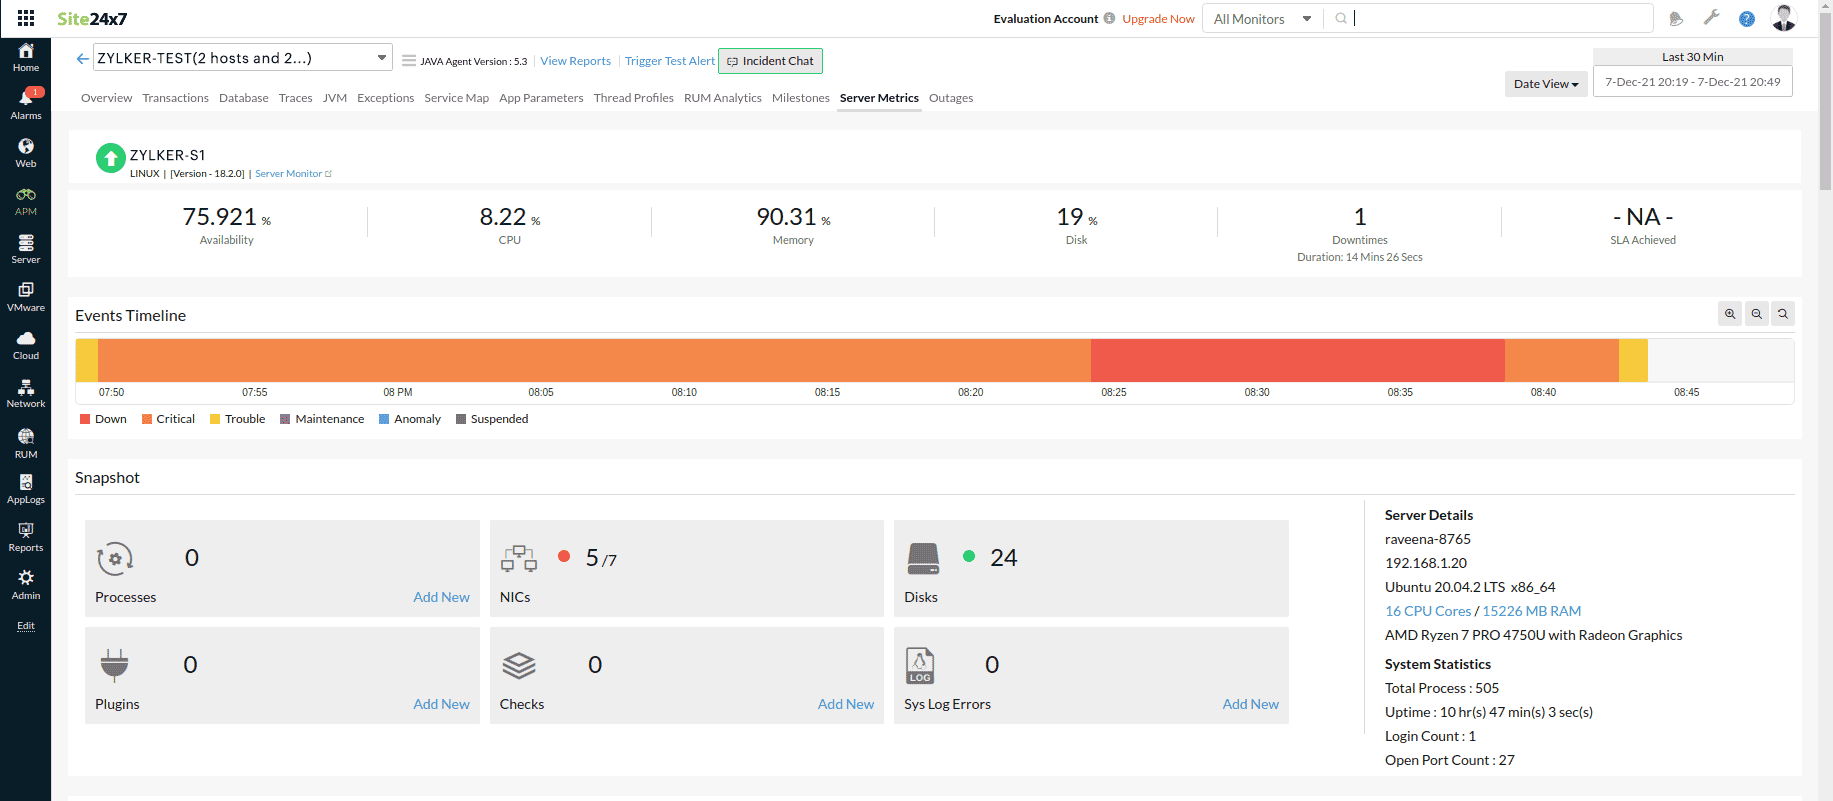
The server and the instance integration happens automatically in the Site24x7 console. Once integrated, the performance metrics of the integrated servers are displayed in the Server Metrics tab on the APM details page.
- During your APM instance monitor creation, the existing server monitor will automatically integrate with the APM instance monitor.
- During server monitor creation, the server monitor will not automatically integrate with the existing APM instance monitor. Instead, it will be mapped during the restart of the APM instance monitor.
The APM instance monitor and the server monitor must have the same hostname.
Server Metrics dashboard
Log in to the Site24x7 web client and go to APM > APM Insight > Monitors, select any monitor, and navigate to the Server Metrics tab to see the performance metrics for the integrated servers. You can also view the server metrics at the instance level and application level separately.
Application-level metrics
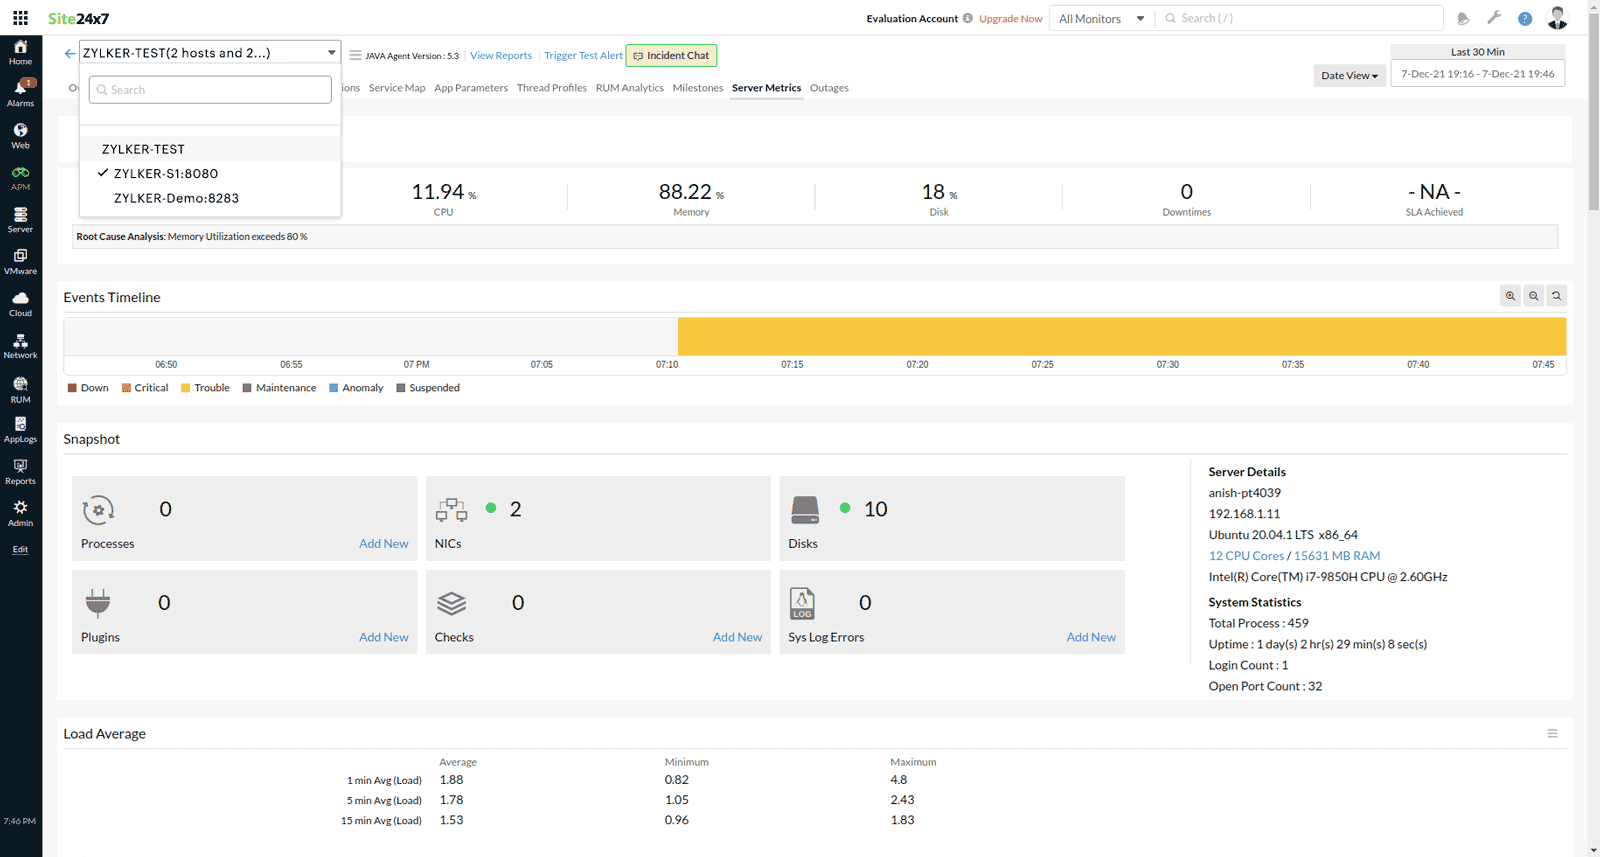
If you choose the application name from the top-left menu, you will get the complete list of the server monitors associated with your application.

You can view the whole picture of performance metrics by clicking on the server monitor.

Instance-level metrics
If you choose the instance name from the top-left menu, you will get a thorough picture of all the major performance metrics of the associated server.

Service Map
The Service Map helps you detect and troubleshoot your application problems related to the associated servers before your customers are impacted.
Map View
You can view key metrics such as Availability, CPU, Memory, and Disk utilization of the server mapped with the corresponding component by hovering the mouse over the component. The Server Metrics tab of the appropriate node is accessed by clicking on the metrics.

Graph View
You can see graphs of the server's important metrics connected with a certain component, like MySQL, Cassandra, or Redis.

Table View
The tabular view lists all the components along with their associated servers. Clicking on an individual server takes you to the corresponding Graph View, and clicking on the metrics bar takes you to the corresponding Server Metrics tab.

Traces
Navigate to Traces > Server Metrics to see graph views of the server's important metrics before and after the trace start time. The red mark on the graph indicates the trace's start time. This helps the user to get information on the status of the corresponding server at the specified time.

Major benefits of integrating APM Insight with your servers
Unified dashboard
On a single dashboard, you can see a comprehensive list of all the server monitors mapped to the instances of your application.

IT automation
- Associate server-related IT Automation Templates to your application, such as server scripts, server commands, and server reboots, to resolve server issues at the application level automatically. These templates can be applied to all of your application's infringed servers at the same time.
- The new types of IT automation, Thread Dump and Heap Dump, automatically generate thread dump and heap dump files on the specified folder.
If you aren't using any IT automations yet, learn how to add one.
Classification of alerts
Server integration provides a wide array of performance monitoring capabilities at the application level. The server integration alerts are classified as Trouble, Critical, and Down. When your server exceeds the specified threshold values, you will receive alerts based on the threshold configuration of the corresponding server.
Your application will only be reported as Down if all of the servers that are integrated with it are down.
Dependency relation between the server and APM instance
| Server monitor | Mapped APM instance monitor | Alert email notification | Alarms tab notification |
|---|---|---|---|
| UP | DOWN | APM instance | - |
| DOWN | DOWN | Server monitor | Server monitor |
| UP | CRITICAL/TROUBLE | APM instance | - |
| CRITICAL/TROUBLE | CRITICAL/TROUBLE | Server monitor and APM instance | Server monitor |
| CRITICAL/TROUBLE | DOWN | Server monitor and APM instance | Server monitor |
Learn about the alert emails sent from Site24x7.
