Azure Database for PostgreSQL - Flexible Server monitoring integration
Azure Database for PostgreSQL is a fully managed service based on the PostgreSQL open-source relational database. A Flexible Server aims to give users more flexibility and control over database management capabilities and server configuration options. With the Flexible Server model, users can choose high availability within a single availability zone or across multiple availability zones.
With Site24x7's integration, you can monitor your hosted databases for PostgreSQL - Flexible Server, obtain reliable metrics, define thresholds, and get alerts when there is a breach.
Setup and configuration
- Adding Azure Database for PostgreSQL - Flexible Server while configuring a new Azure monitor
If you have not configured an Azure monitor yet, add one by following the steps below:
- Log in to your Site24x7 account.
- Go to Cloud > Azure > Add Azure Monitor. You can also follow these steps to add an Azure monitor.
- During Azure monitor configuration, on the Edit Azure Monitor page, select Azure Database for PostgreSQL Flexible Server from the Service/Resource Types drop-down menu.
- Adding Azure Database for PostgreSQL - Flexible Server to an existing Azure monitor
If you already have an Azure monitor configured for the tenant, you can add Azure Database for PostgreSQL - Flexible Server by following the steps below:
- Log in to your Site24x7 account.
- Go to Cloud > Azure, select your Azure monitor, then go to any of the dashboards on the left pane of your Azure monitor.
- Click the hamburger icon
 and select Edit, which brings you to the Edit Azure Monitor page.
 - On the Edit Azure Monitor page, select the corresponding Subscriptions and Resource Groups from the drop-down menus, select Azure Database for PostgreSQL Flexible Server from the Service/Resource Types drop-down menu, and click Save.
- After successful configuration, go to Cloud > Azure > Azure Monitor > Azure Database for PostgreSQL Flexible Server. Now you can view the discovered Azure Database for PostgreSQL - Flexible Server.
Note
Newly added Azure resources will be auto-discovered in the next discovery cycle. For immediate discovery of the selected configuration, go to the Infrastructure Dashboard of the Azure monitor, click the hamburger icon
 , and select Discover Now.
Polling frequency
Site24x7's Azure Database for PostgreSQL Flexible Server monitor collects metric data every minute and the statuses from your databases every five minutes.
Supported metrics
| Metric name | Description | Statistic | Unit |
| Active Connections | The average number of active connections | Average | Count |
| Backup Storage Used | The average amount of backup storage used | Average | Bytes |
| Failed Connections | The total number of failed connections | Total | Count |
| Succeeded Connections | The total number of succeeded connections | Total | Count |
| CPU Credits Consumed | The average number of credits consumed by the database server | Average | Count |
| CPU Credits Remaining | The average number of credits available to burst | Average | Count |
| CPU percent | The average amount of CPU | Average | Percent |
| Disk Queue Depth | The average number of outstanding input and output (I/O) operations on the data disk | Average | Count |
| IOPS | The average number of input and output (I/O) operations per second | Average | Count |
| Maximum Used Transaction IDs | The number of transaction IDs that are used the most | Average | Count |
| Memory percent | The average amount of memory | Average | Percent |
| Network Out | The total amount of outgoing data across active connections | Total | Bytes |
| Network In | The total amount of incoming data across active connections | Total | Bytes |
| Read IOPS | The average number of data disk input and output (I/O) read operations per second | Average | Count |
| Read throughput | The average number of bytes read per second from the data disk during the monitoring period | Average | Count |
| Storage Free | The average amount of free storage | Average | Bytes |
| Storage Percent | The average amount of storage | Average | Percent |
| Storage Used | The average amount of storage used | Average | Bytes |
| Transaction Log Storage Used | The average amount of transaction log storage used | Average | Bytes |
| Write IOPS | The average number of data disk input and output (I/O) write operations | Average | Count |
| Write throughput | The average amount of bytes written per second to the data disk during the monitoring period | Average | Bytes per second |
Threshold configuration
- Global configuration
- In the Site24x7 web client, click Admin on the left navigation pane.
- Select Configuration Profiles from the left pane and select the Threshold and Availability (+) tab from the drop-down menu.
- Click Add Threshold Profile in the top-right corner.
- In the Monitor Type drop-down menu, select Azure Database for PostgreSQL Flexible Server.
- Now you can set the threshold values for all the metrics listed above.
- Monitor-level configuration
- In the Site24x7 web client, go to Cloud > Azure > Azure Monitor > Azure Database for PostgreSQL Flexible Server.
- Choose a resource you would like to set a threshold for, then click the hamburger icon
 .
. - Select Edit, which directs you to the Edit Azure Database for PostgreSQL Flexible Server Monitor page.
- You can set the threshold values for the metrics by selecting Threshold and Availability.
- You can also configure IT Automation at the attribute level.
IT Automation
Site24x7's IT Automation tool helps automatically resolve performance degradation issues. The alarm engine continually evaluates the system events for which thresholds are set and executes the mapped automation when there is a breach.
How to configure IT Automation for a monitor
Configuration Rules
Configure parameters like Threshold Profile, Notification Profile, Tags, and Monitor Group for multiple monitors with Site24x7's Configuration Rules. You can run a scan and associate any of the previously generated rules that suit the monitor configurations while adding new monitors.
How to add a Configuration Rule
Summary
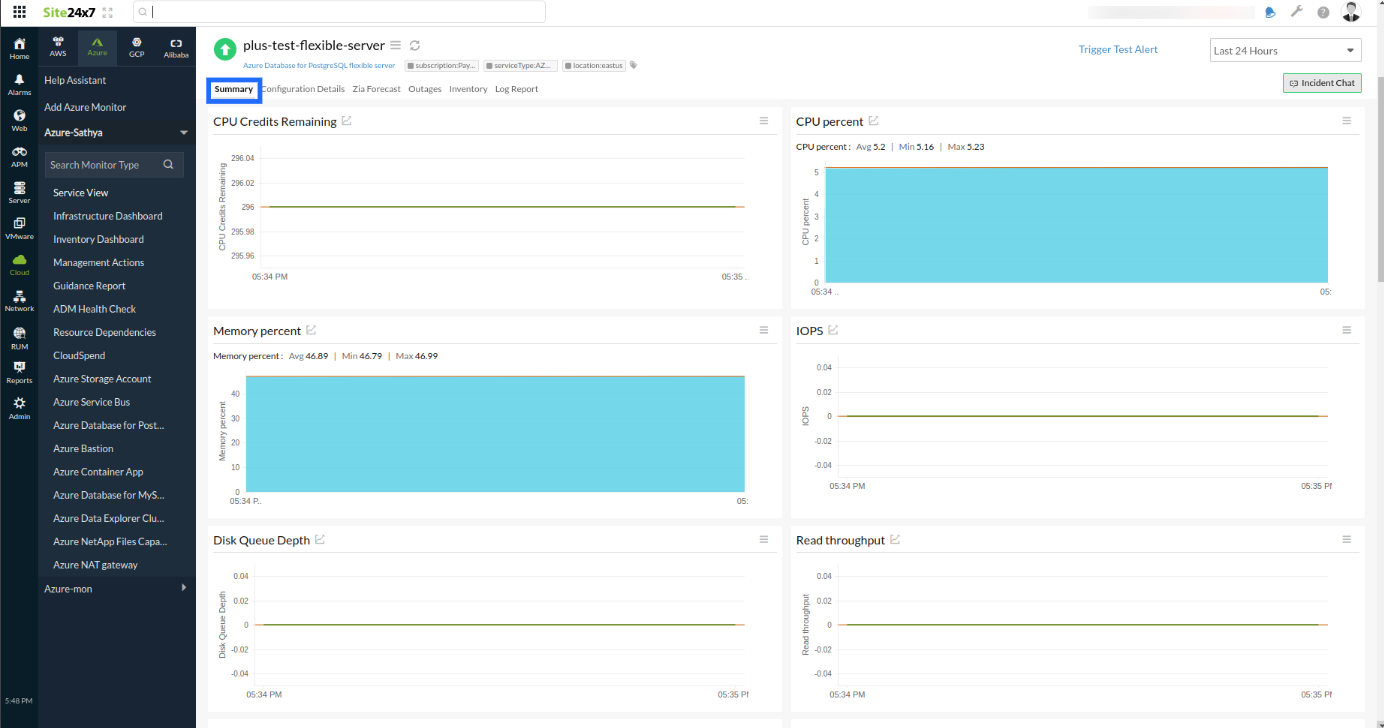
The Summary tab will give you the performance data organized by time for the metrics listed above.
- To view the summary, go to Cloud > Azure > Azure Monitor > Azure Database for PostgreSQL Flexible Server.
- Select a resource and click the Summary tab.
- By doing so, you can view the Active Connections, Backup Storage Used, Failed Connections, and much more.
Configuration Details
The configuration details of an application instance are provided under the Configuration Details tab.
- To get the configuration details, go to Cloud > Azure > Azure Monitor > Azure Database for PostgreSQL Flexible Server.
- Select a resource and click the Configuration Details tab.
- Here, you can find the Availability Zone, State, Storage Size GB, Backup Retention Period, and more.
Reports
Gain in-depth data about the various parameters of your monitored resources and highlight your service performance using our insightful reports.
To view reports for Azure Database for PostgreSQL - Flexible Server:
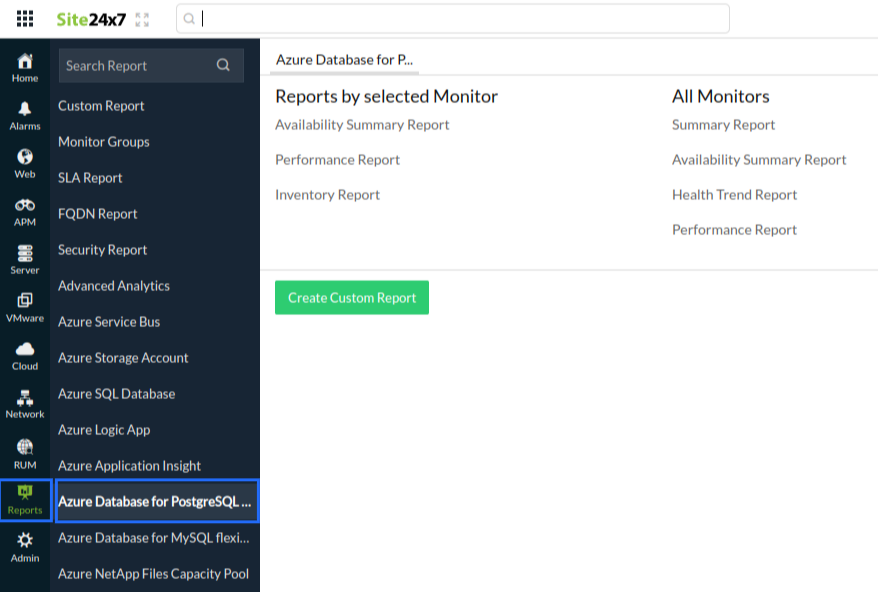
- Go to the Reports section on the left navigation pane.
- Select Azure Database for PostgreSQL Flexible Server from the menu on the left.
- You can find the Availability Summary Report, Performance Report, and Inventory Report for one selected monitor, or you can get the Summary Report, Availability Summary Report, Health Trend Report, and Performance Report for all the Azure Database for PostgreSQL Flexible Server monitors.

You can also get reports from the Summary tab of the Azure Database for PostgreSQL Flexible Server monitor.
- Click the Summary tab of the Azure Database for PostgreSQL Flexible Server monitor and get the Availability Summary Report of the monitor by clicking Availability or Downtime.
- You can also find the Performance Report of the monitor by clicking any chart title.

