Azure Storage Account Monitoring Integration
An Azure storage account stores all of your storage data objects, including blobs, file shares, queues, tables, and disks. The storage account creates a unique namespace for your Azure Storage data that can be accessed through HTTP or HTTPS from anywhere in the world.
With Site24x7's integration, you can now monitor your storage account with accurate metrics, configure thresholds, get alerts, and prevent any failure beforehand.
Set up and configuration
Adding an Azure storage account while configuring a new Azure monitor
If you haven't configured an Azure monitor yet, add one by following the steps below:
- Log in to your Site24x7 account.
- Choose Cloud from the left navigation pane, and select Azure > Add Azure Monitor. You can also follow these steps to add an Azure monitor.
- During Azure monitor configuration in the Edit Azure Monitor page, select Azure Storage Account from the Service/Resource Types drop-down.
Adding an Azure storage account to an existing Azure monitor
If you already have an Azure monitor configured for the tenant, you can add the Azure storage account by using the following steps:
- Log in to your Site24x7 account.
- Navigate to the Infrastructure, Inventory, or Management Dashboard from the left pane of the Azure monitor for which you wish to add an Azure storage account.
- Click the hamburger icon
 and then Edit, which will bring you to the Edit Azure Monitor page.
 - In the Edit Azure Monitor page, select the corresponding Subscription and Resource Group from the drop-down menu, select Azure Storage Account from the Service/Resource Types drop-down, and click Save.
After successful configuration, go to Cloud > Azure, and select Azure Storage Account from the Azure monitor drop-down. Now you can view the discovered storage accounts.
It will take 15-30 minutes to discover new Azure resources. For immediate discovery of the selected configuration, go to the Infrastructure Dashboard of the Azure monitor and click on Discover Now from the ![]() icon.
icon.
Polling frequency
Site24x7's Azure Storage Account Monitor collects metric data every minute and the statuses from your storage accounts every five minutes.
Supported metrics
The following metrics are collected:
| Metric name | Description | Statistic | Unit |
|---|---|---|---|
| Availability | The percentage of availability for the storage service or the specified API operation: availability is calculated by taking the TotalBillableRequests value and dividing it by the number of applicable requests, including those that produced unexpected errors. All unexpected errors result in reduced availability for the storage service or the specified API operation. | Average | Percent |
| Egress | The amount of egress data: this number includes egress to external clients from Azure storage as well as egress within Azure. As a result, this number does not reflect billable egress. | Average | Bytes |
| Ingress | The amount of ingress data: this number includes ingress from an external client into Azure Storage as well as ingress within Azure. | Average | Bytes |
| Success E2E Latency | The average end-to-end latency of successful requests made to a storage service or the specified API operation in milliseconds: this value includes the required processing time within Azure storage to read the request, send the response, and receive acknowledgment of the response. | Average | Milliseconds |
| Success Server Latency | The average time used to process a successful request by Azure storage: this value does not include the network latency specified in Success E2E Latency. | Average | Milliseconds |
| Transactions | The number of requests made to a storage service or the specified API operation: this number includes successful and failed requests along with requests that produced errors. | Average | Count |
| Used capacity | The amount of storage used by the storage account: for standard storage accounts, it's the sum of the capacity used by blobs, tables, files, and queues. For premium storage accounts and blob storage accounts, it is the same as the Blob Capacity or File Capacity. | Average | Bytes |
Threshold configuration
Global configuration
- Go to the Admin section on the left navigation pane.
- Select Configuration Profiles from the left pane and choose the Threshold and Availability (+) tab from the drop-down menu.
- Choose the monitor type as Azure Storage Account.
You can also set the threshold values for all the metrics mentioned above.
Monitor-level configuration
- Go to Cloud > Azure and select Azure Storage Account from the drop-down menu.
- Choose a resource for which you would like to set a threshold and then click the hamburger icon
 . Choose the Edit option, which will direct you to the Edit Azure Storage Account Monitor page.
You can set the threshold values for the metrics by selecting the Threshold and Availability option. You can also configure IT Automation at the attribute level.
IT Automation
Site24x7's IT Automation tools help auto-resolve performance degradation issues. The alarm engine continually evaluates the system events for which thresholds are set and executes the mapped automation when there is a breach.
How to configure IT Automation for a monitor.
Configuration Rules
Configure parameters like Threshold Profile, Notification Profile, Tags, Monitor Group, and others for multiple monitors with Site24x7's Configuration Rules. You can run a scan and associate any of the previously generated rules that suit the monitor configurations while adding new monitors.
How to add a configuration rule.
Summary
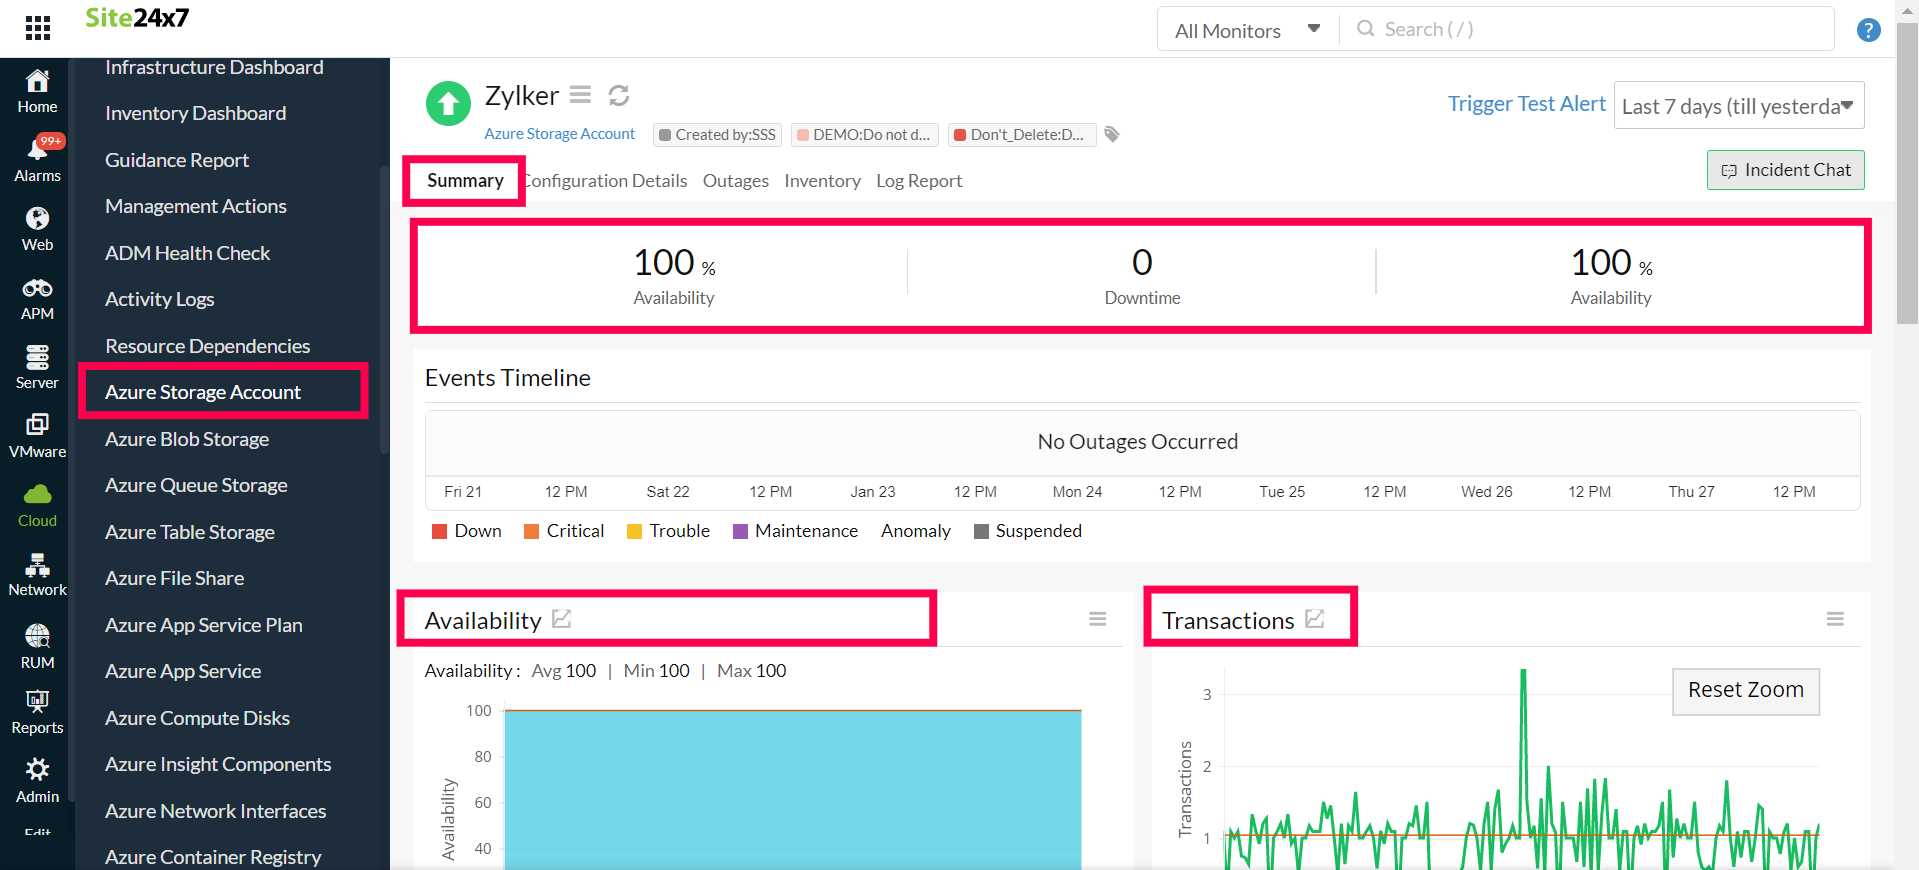
The Summary tab will give you the performance data organized by time for the above mentioned metrics.
- To view the summary, go to Cloud > Azure and click the Azure monitor > Azure Storage Account.
- Click a resource and select the Summary tab.
Doing this allows you to view the Availability, Ingress, Egress, and much more.
Configuration Details
The Configuration Details of an application instance are provided under this tab. Here, you'll find the Storage Account type, Endpoints, Encryptionrelatedconfigurations and so on.
- To get the configuration details, go to Cloud > Azure and click the Azure monitor > Azure Storage Account.
- Click a resource and select the Configuration Details tab.
Reports
Gain in-depth data about the various parameters of your monitored resources and highlight your service performance using our insightful reports.
To view reports for your Azure storage account:
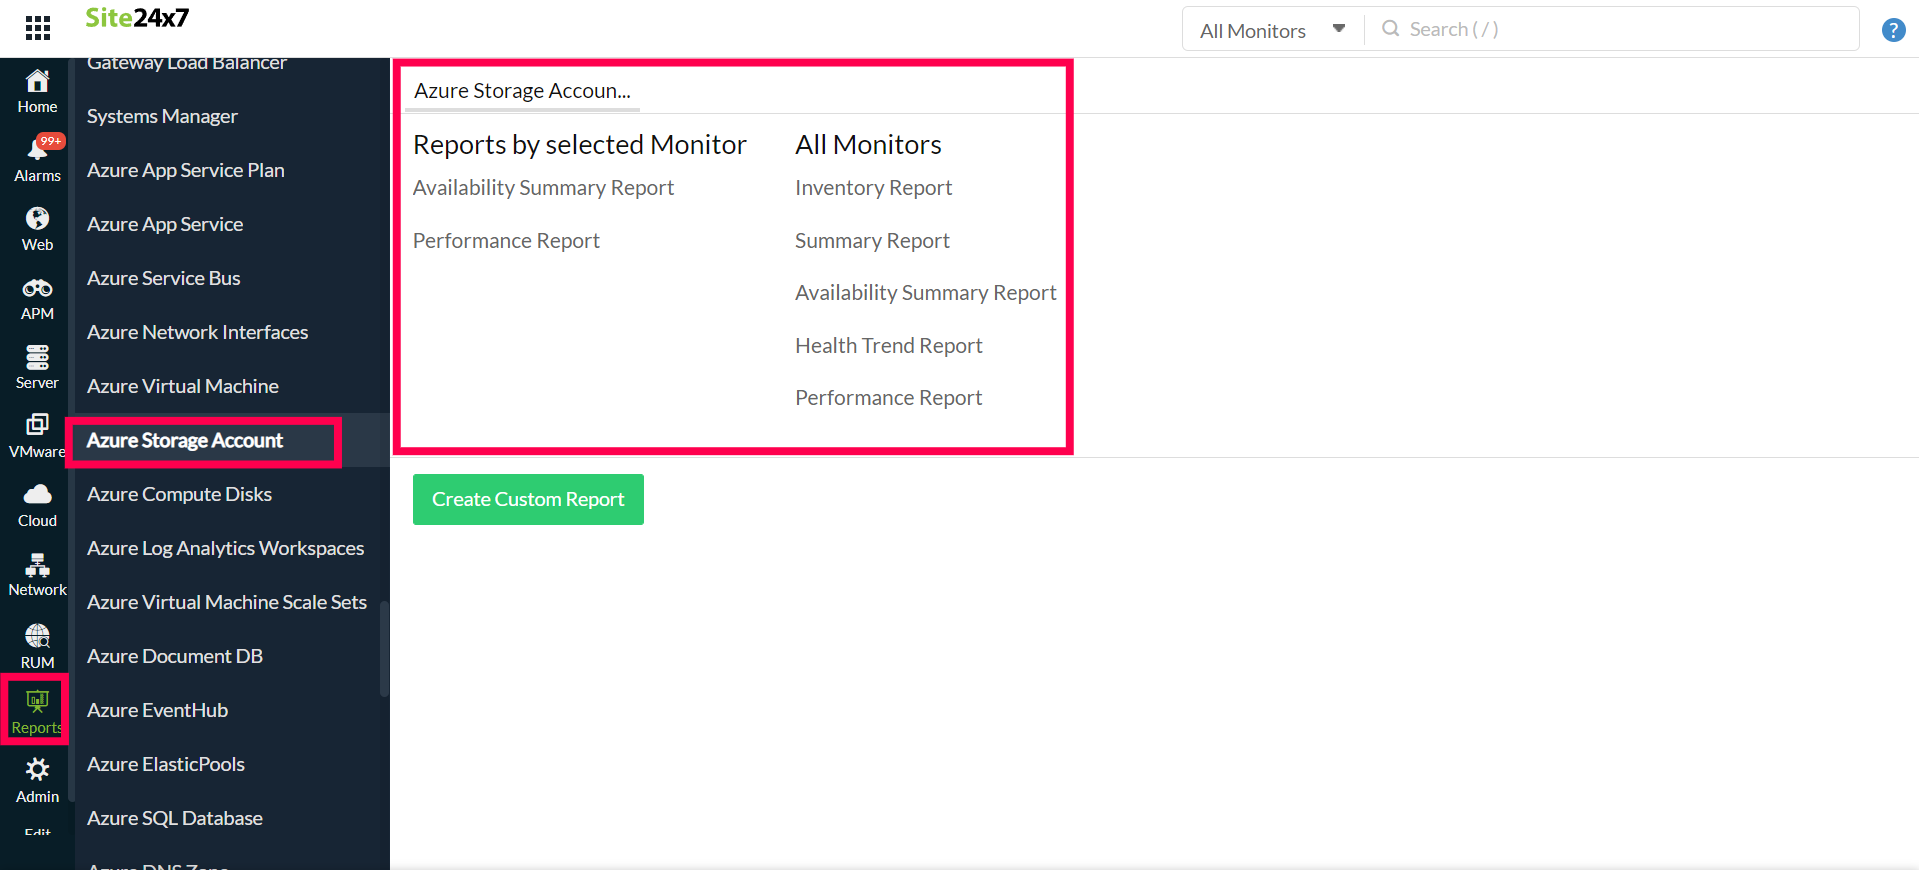
- Navigate to the Reports section on the left navigation pane.
- Select Azure Storage Account from the menu on the left.
You can find the Availability Summary Report and the Performance Report for one selected monitor, or you can get the Inventory Report, Summary Report, Availability Summary Report, Health Trend Report, and the Performance Report for all the storage account monitors.

You can also get reports from the Summary tab of the Azure Storage Account Monitor.
- Go to the Summary tab of the Azure Storage Account Monitor, and get the Availability Summary Report of the monitor by clicking on Availability or Downtime.
- You can also find the Performance Report of the monitor by clicking on any chart title.

Related links:
How to add an Azure monitor.
How to configure IT automations for a monitor.
How to integrate an Azure App Service monitor.
How to integrate Azure Virtual Machine monitor.
How to configure IT automations for a monitor.
View the list of monitor reports.
