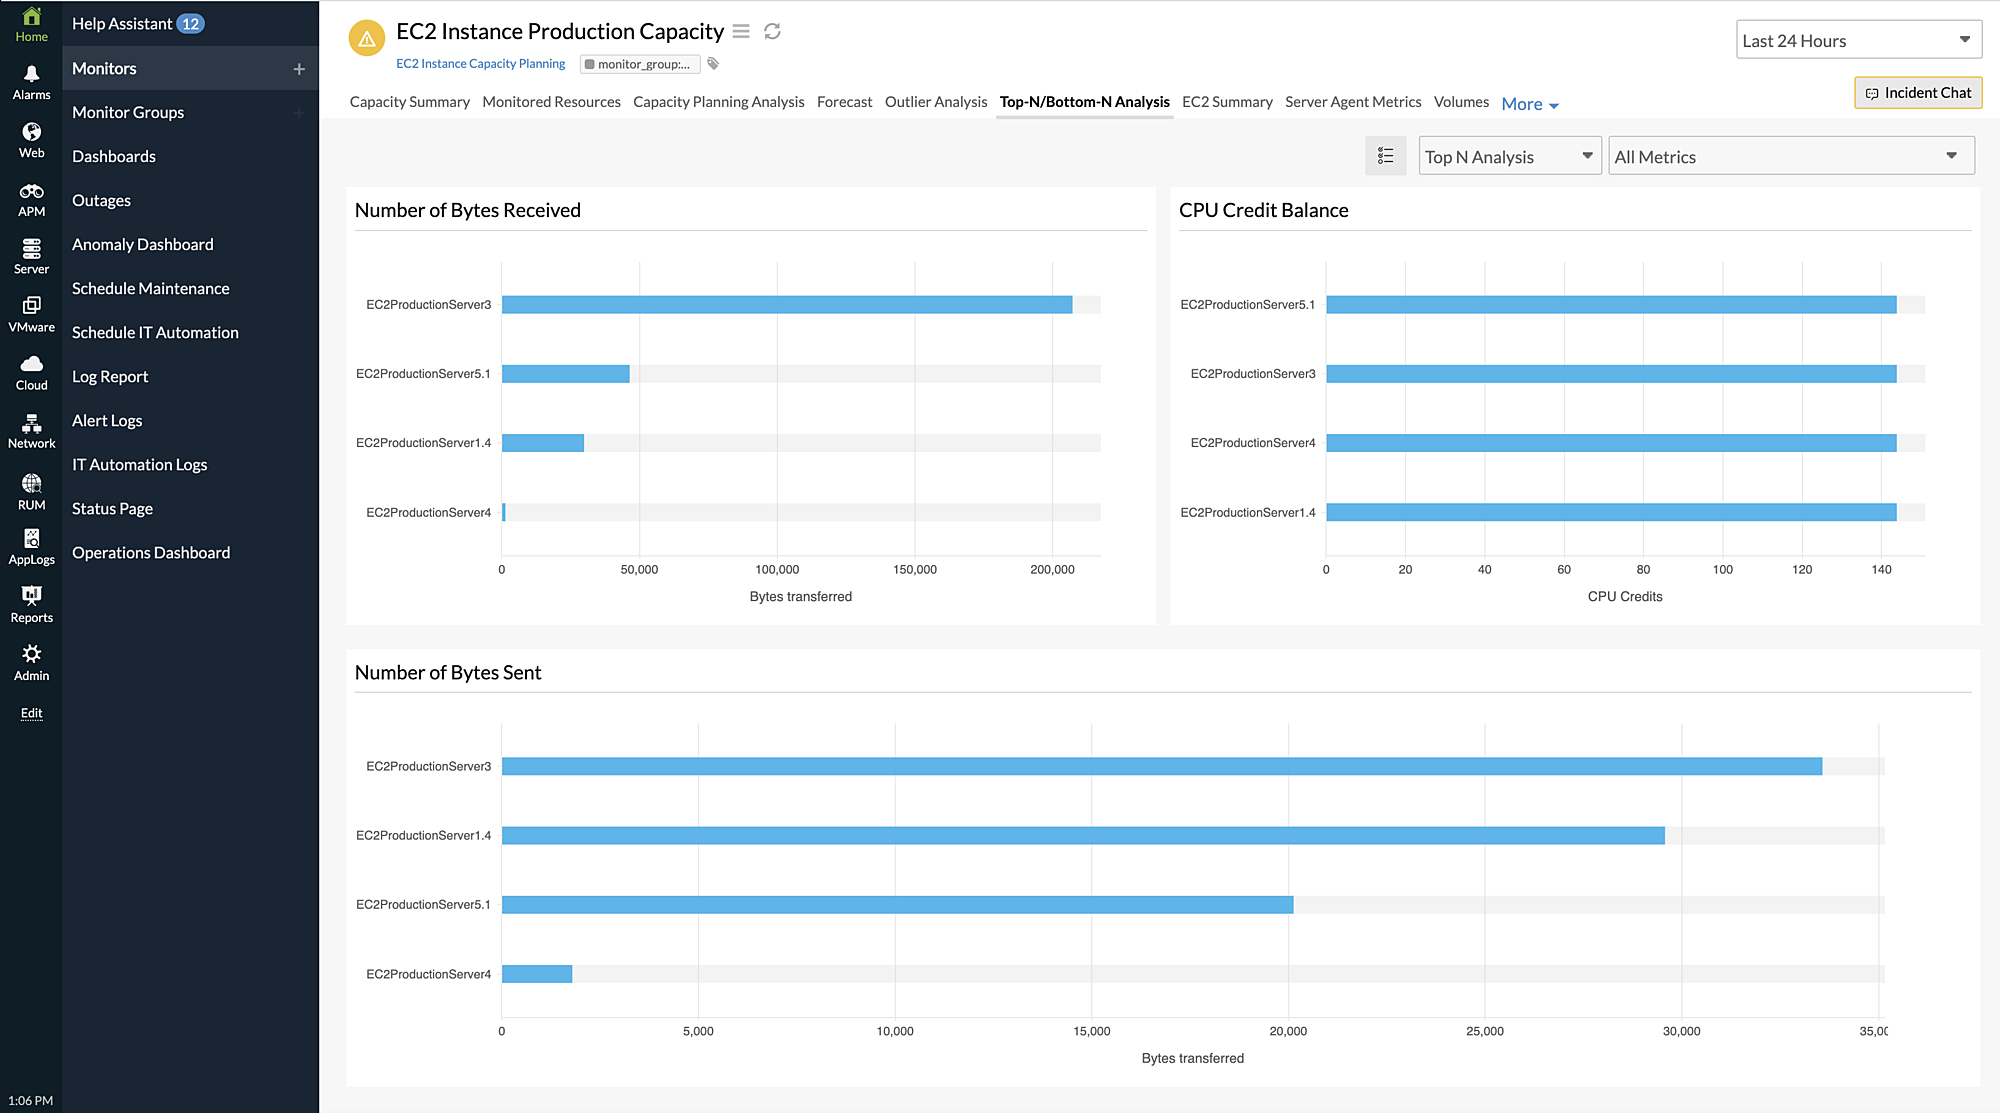
Top-N/Bottom-N Analysis for Capacity Planning Monitors
The Top-N/Bottom-N Analysis tab displays the top and bottom performance variations for monitors grouped under Capacity Planning based on performance metrics.

Benefits of Top-N/Bottom-N Analysis
- Identify the workload each monitor shares from these reports.
- View the top and least contributors based on the performance.
Use case
The Top-N/Bottom-N gives the performance variation among monitors. For example, the top 10 monitors displayed based on Disk Busy Percentage helps you identify which of the servers' disks are busy and which are idle. The bottom 10 monitors displayed based on CPU Credit Balance gives an idea of EC2 Instances with low CPU credits and high CPU credits.
