Performance Metrics of DNS Server Monitor
Interpret DNS Server Monitoring Results
The DNS (Domain Name System), also called the "phone book of the Internet", resolve the domain names to their corresponding numerical IP addresses. The Web dashboard has a custom status banner, which identifies the various configured monitors by segregating them based on their operational status and state. You can also view the number of operational monitors and alert credits remaining in your account. By clicking the "+ Buy More" button, you can purchase additional monitors and alert credits. Additionally, it validates the DNS security by authenticating the DNS responses. To view the performance results of your DNS Server monitor, click on the configured DNS Server listed under Site24x7 Web dashboard. The performance reports are laid out in the form of graphs, charts and tables. They help you undertake a comprehensive analysis of your DNS Server performance. You can share the monitor details via an email. Email can be sent to only those verified users who have agreed to receive emails from Site24x7.
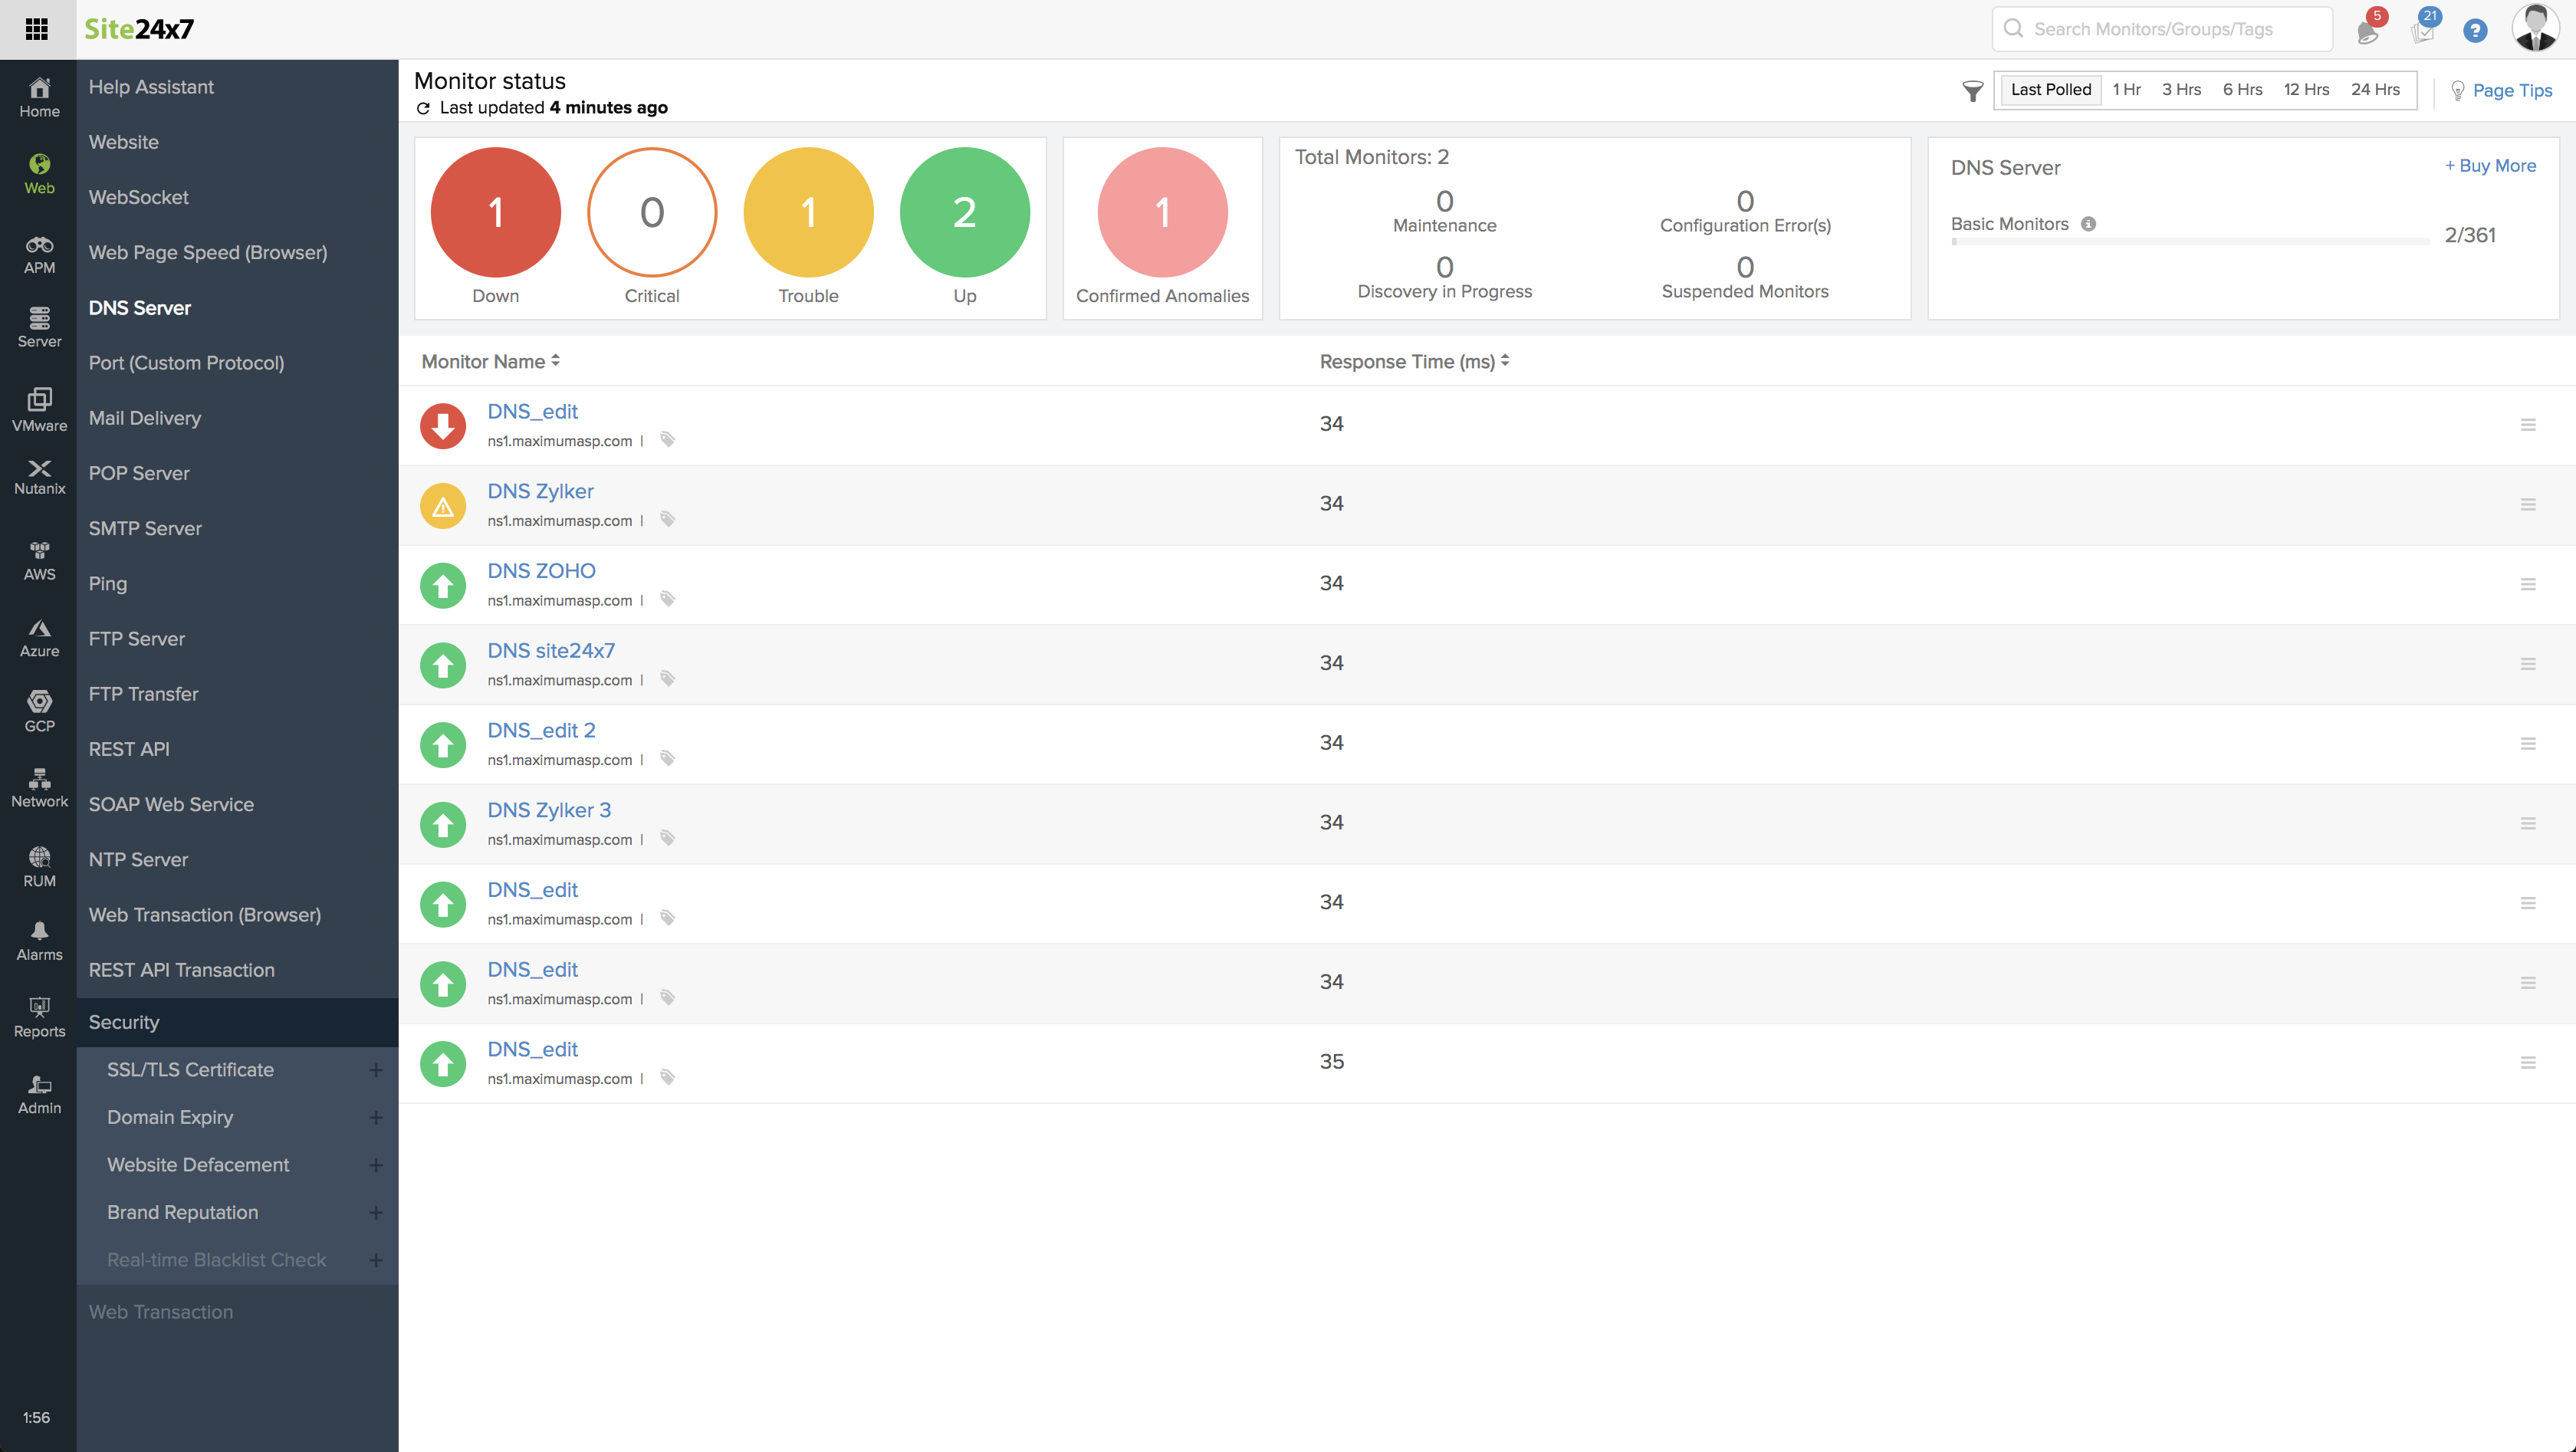
The critical parameters that are captured and listed in the details page are:
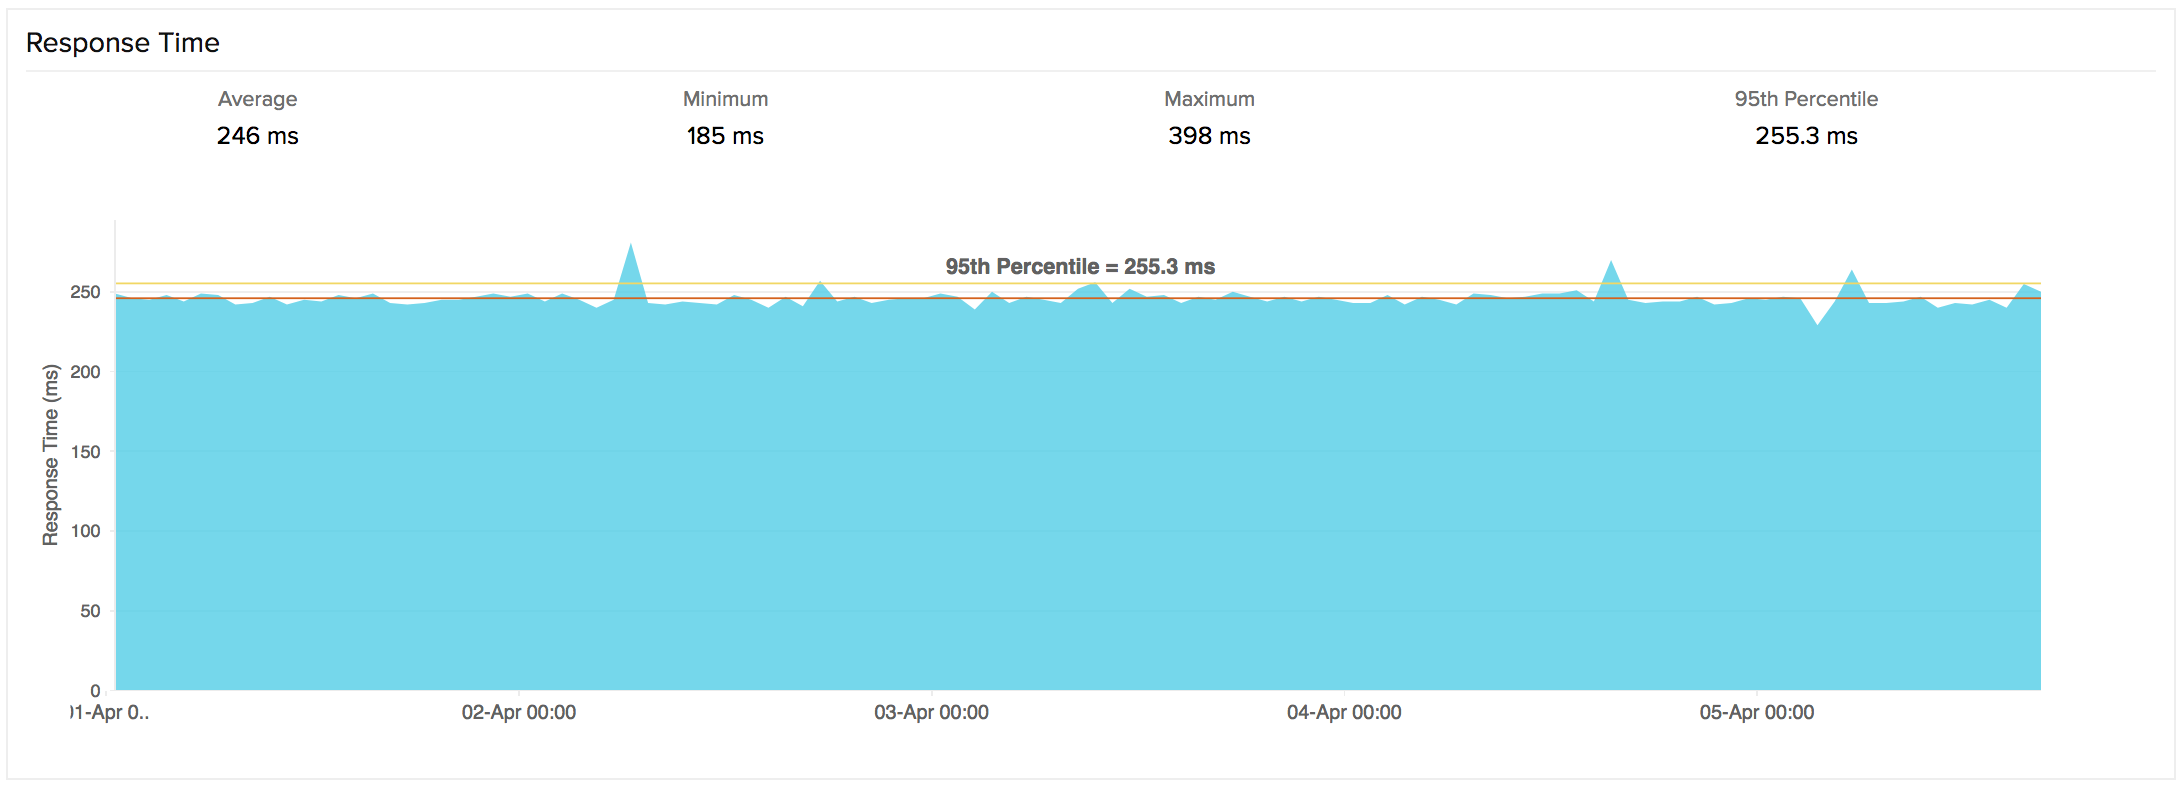
- Response Time, which outlines the domain resolution time of the DNS server in milliseconds. This data is provided as a graphical report.
- Availability & Response Time by Location, which gives a graphical and tabular report of location based availability of the DNS Server and DNS resolution time in milliseconds.
- DNS Security: Domain Name System Security Extensions (DNSSEC) technology is used to protect against external hijacks by digitally 'signing' data so you can be assured it is valid. On enabling the DNSEC validation, we authenticate the DNS responses and validate the security. The Summary widget in DNS details page lists whether the DNS is DNSSEC enabled or not.
| Monitor Status | DNSSEC Status |
| UP/TROUBLE | 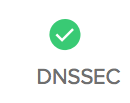 when the response is digitally validated and when the response is digitally validated and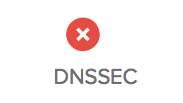 when the response can't be validated. when the response can't be validated. |
| DOWN |  since the DNS couldn't be resolved. since the DNS couldn't be resolved. |
| CONFIGURATION ERROR |  since the DNS couldn't be resolved. since the DNS couldn't be resolved. |
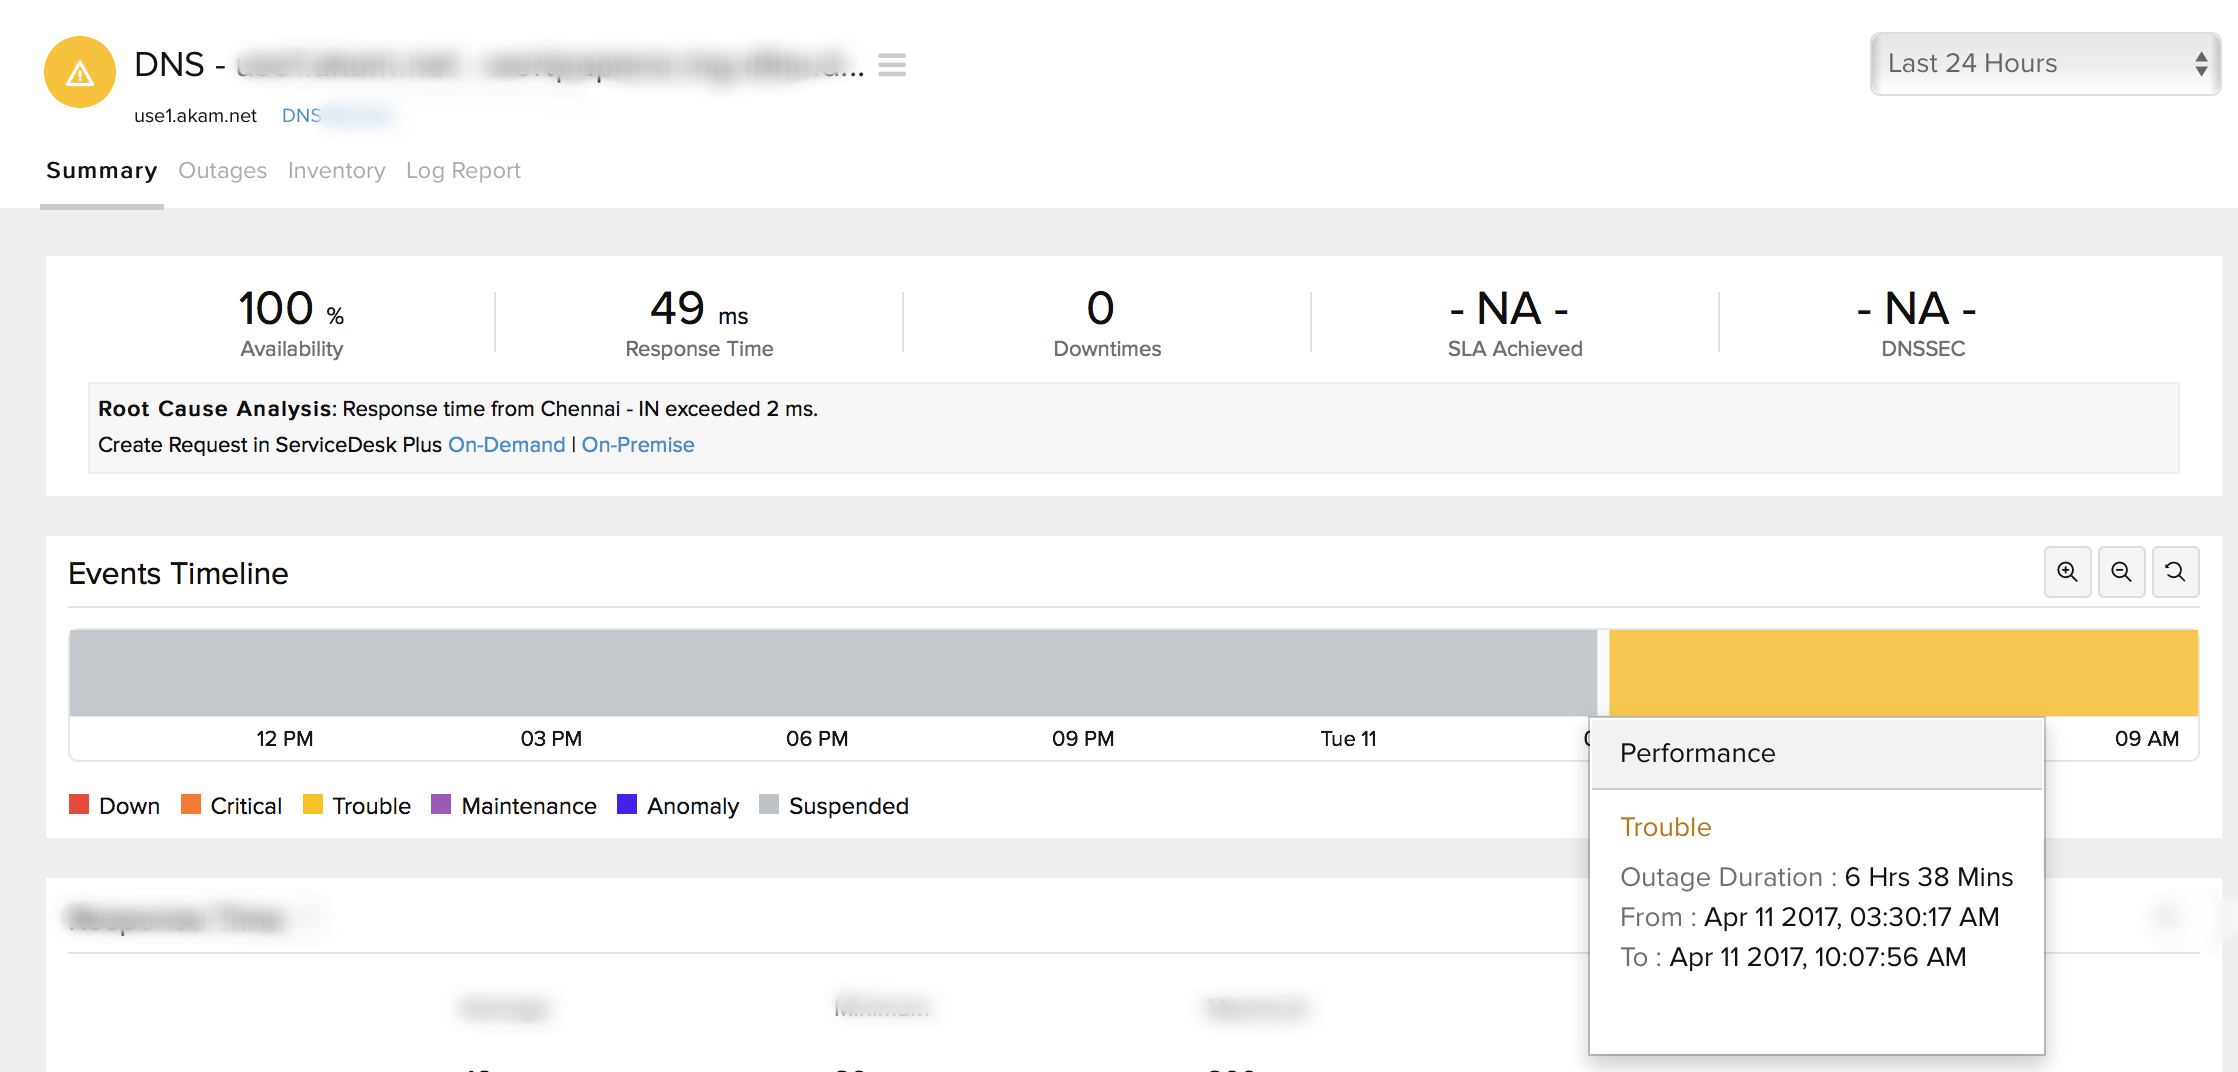
Events Timeline:
Events timeline widget records all the past events of your selected monitor for a selected time range. You can identify/decode various events from the past, which includes Down, Critical, Trouble, Maintenance, Suspended, or Anomalies. Each event are color coded for easy identification. Events can be drilled down to extract maximum data and facilitate easy troubleshooting. You can also track the actual outage period and the total outage duration during a specific block of time.
Response Time
The DNS resolution time across all the configured locations for a chosen period of time is calculated and shown using an XY area graph. This data gives you a holistic view about the functioning of your DNS Server. Average/95th Percentile values depend on the time period chosen for reporting. You can further filter out the three point, five point moving averages and also the 95 percentile by selecting the appropriate legends. The graph also lets you zoom in and isolate the exact data from the graphical spikes. You can also add specific notes to inform users about the various outages and maintenance activities.
Graphical Representation
Response Time by Location
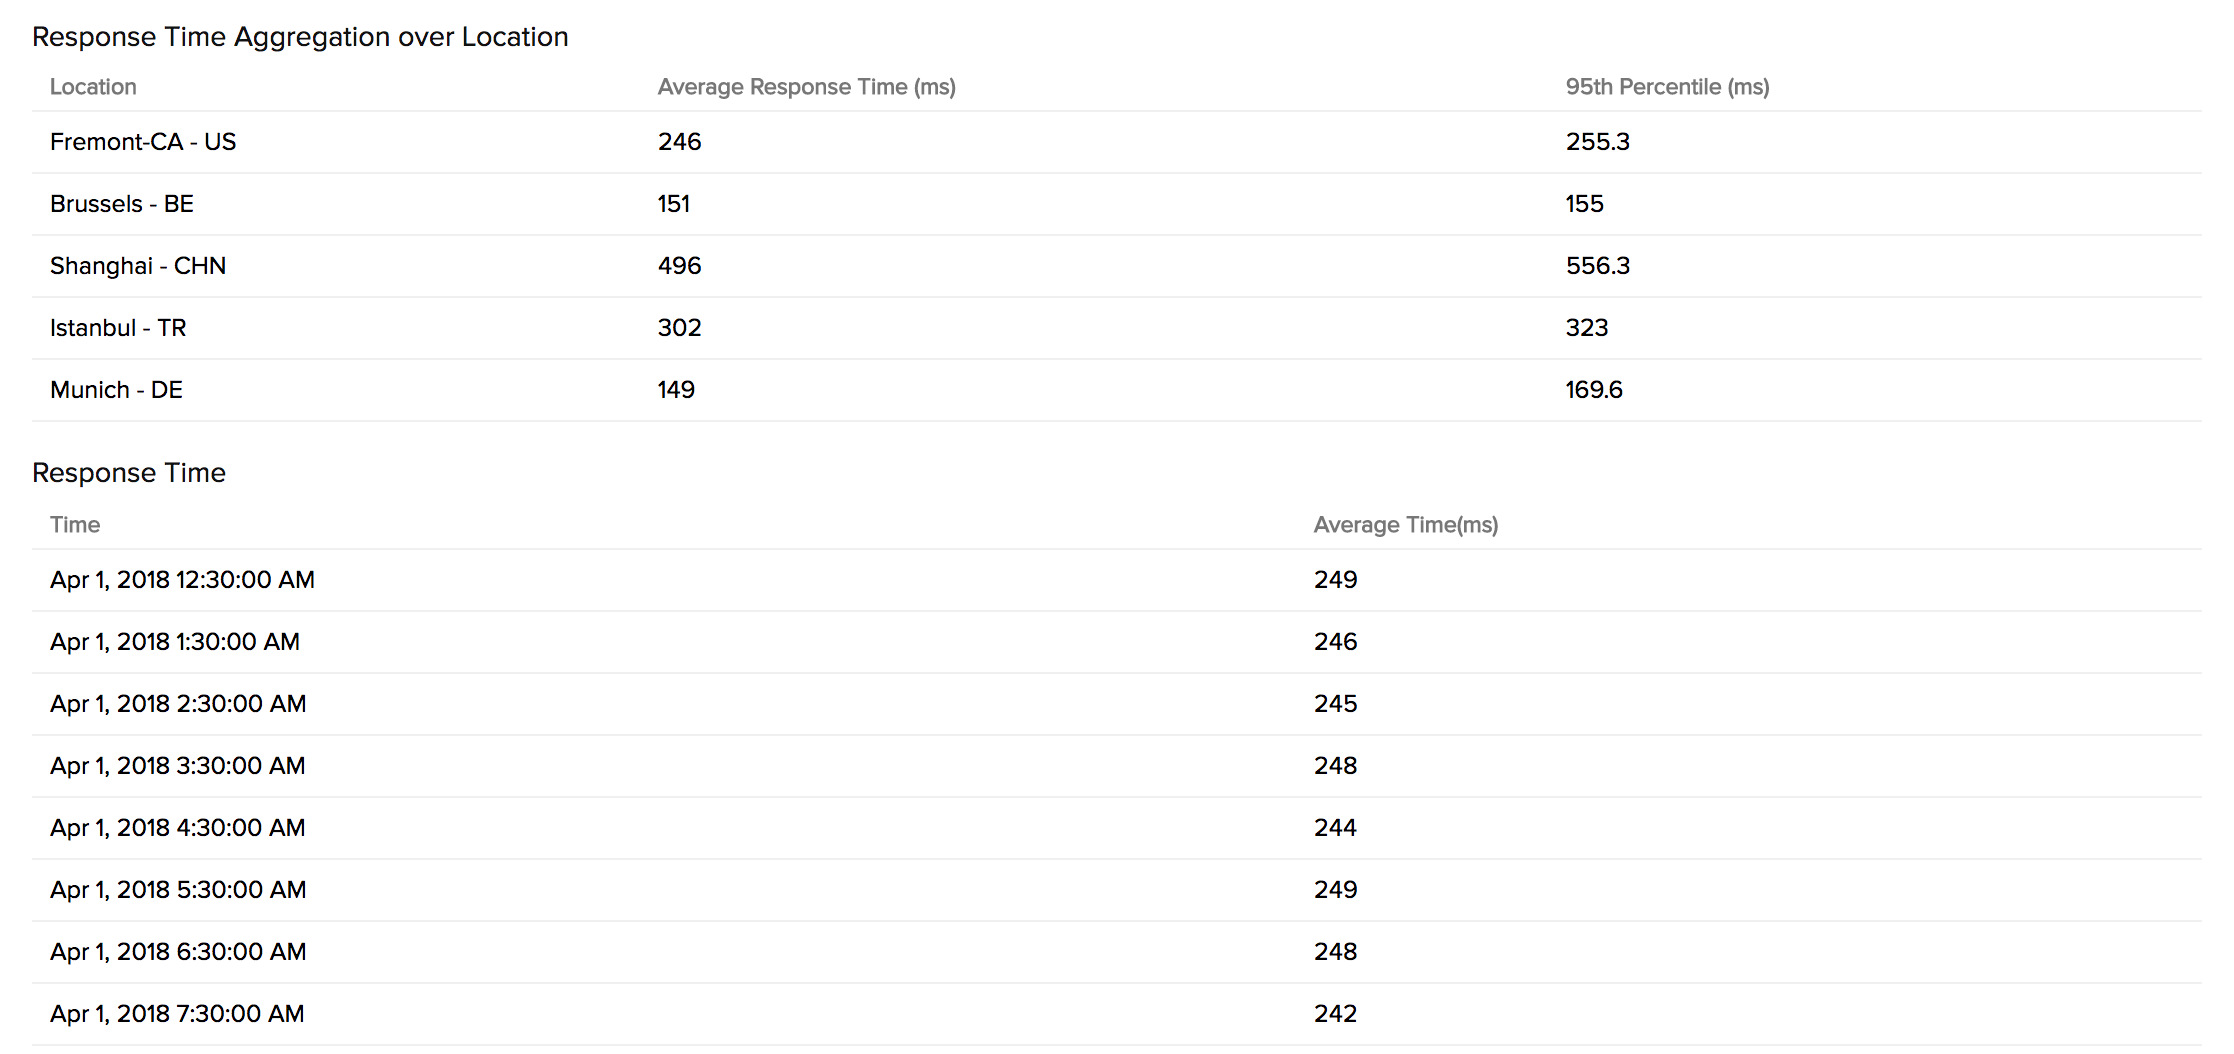
Response Time by Location graph provides the average/95th Percentile DNS resolution time for each day or hour from every monitoring location. This data can be used to check the average/95th Percentile response time of your monitors from different monitoring locations. Location legends are provided with the graph. Additionally, you can filter out the various locations by choosing the appropriate legends. The graph also lets you zoom in and isolate the exact data from the graphical spikes.

Tabular Representation
Average Response Time and Average/95th Percentile Response Time by Location are shown in a tabular report.
Outages
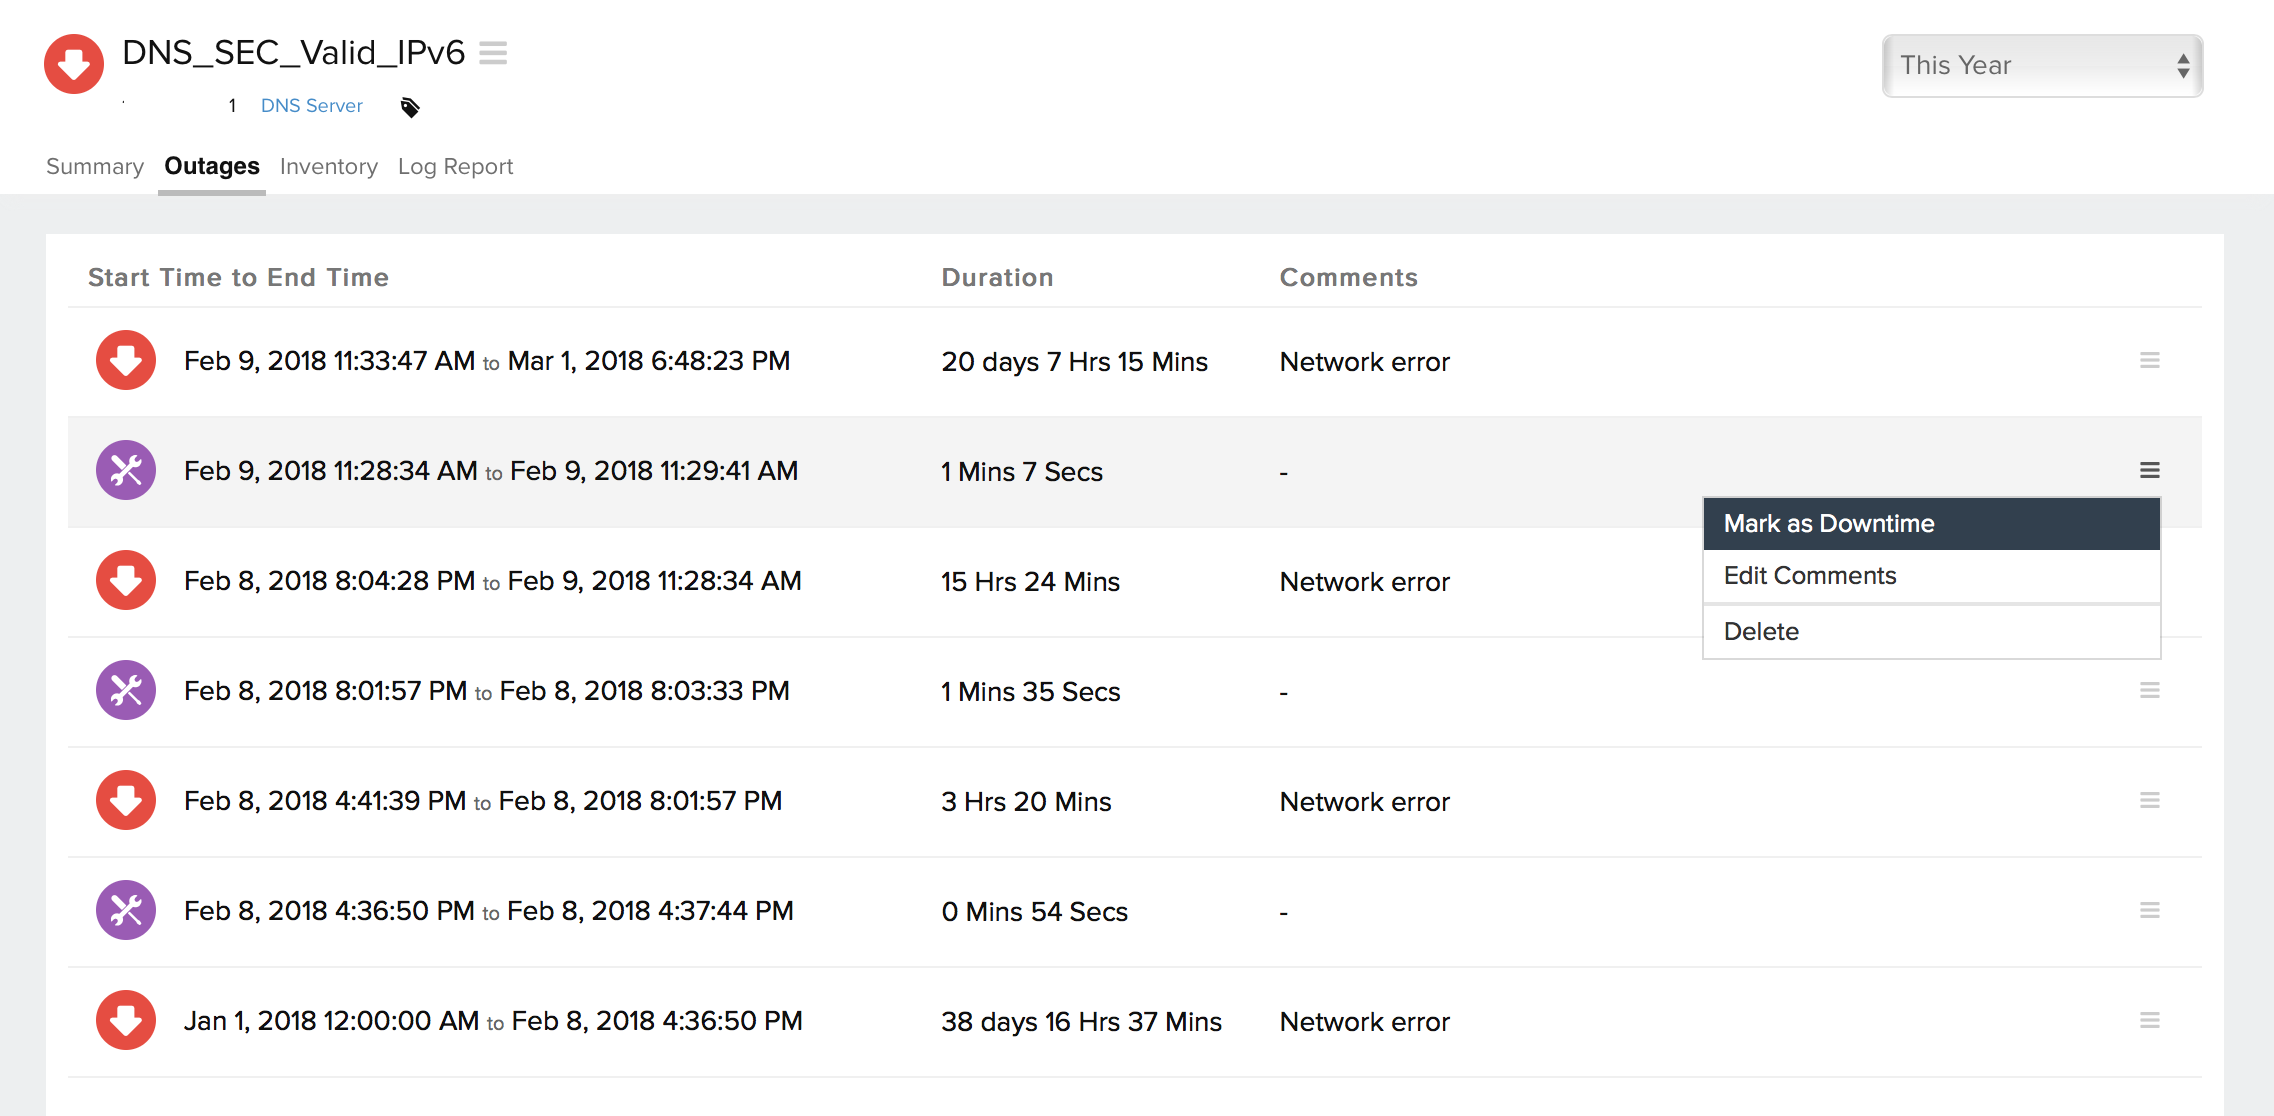
You can access the Outages tab in your monitor's details page to gather detailed insights on the various outage and maintenance downtimes. It provides you with sufficient information to troubleshoot issues. You'll also be able to access the root cause analysis reports for your various outages. On accessing the ![]() icon of a listed monitor outage or maintenance, you'll be shown the options to:
icon of a listed monitor outage or maintenance, you'll be shown the options to:
- Mark as Maintenance: Mark an outage as Maintenance
- Mark as Downtime: Mark a Maintenance as Downtime
- Edit Comments: Add/Edit Comments
- Delete: Delete an Outage/Maintenance permanently
Root Cause Analysis (RCA) Report:
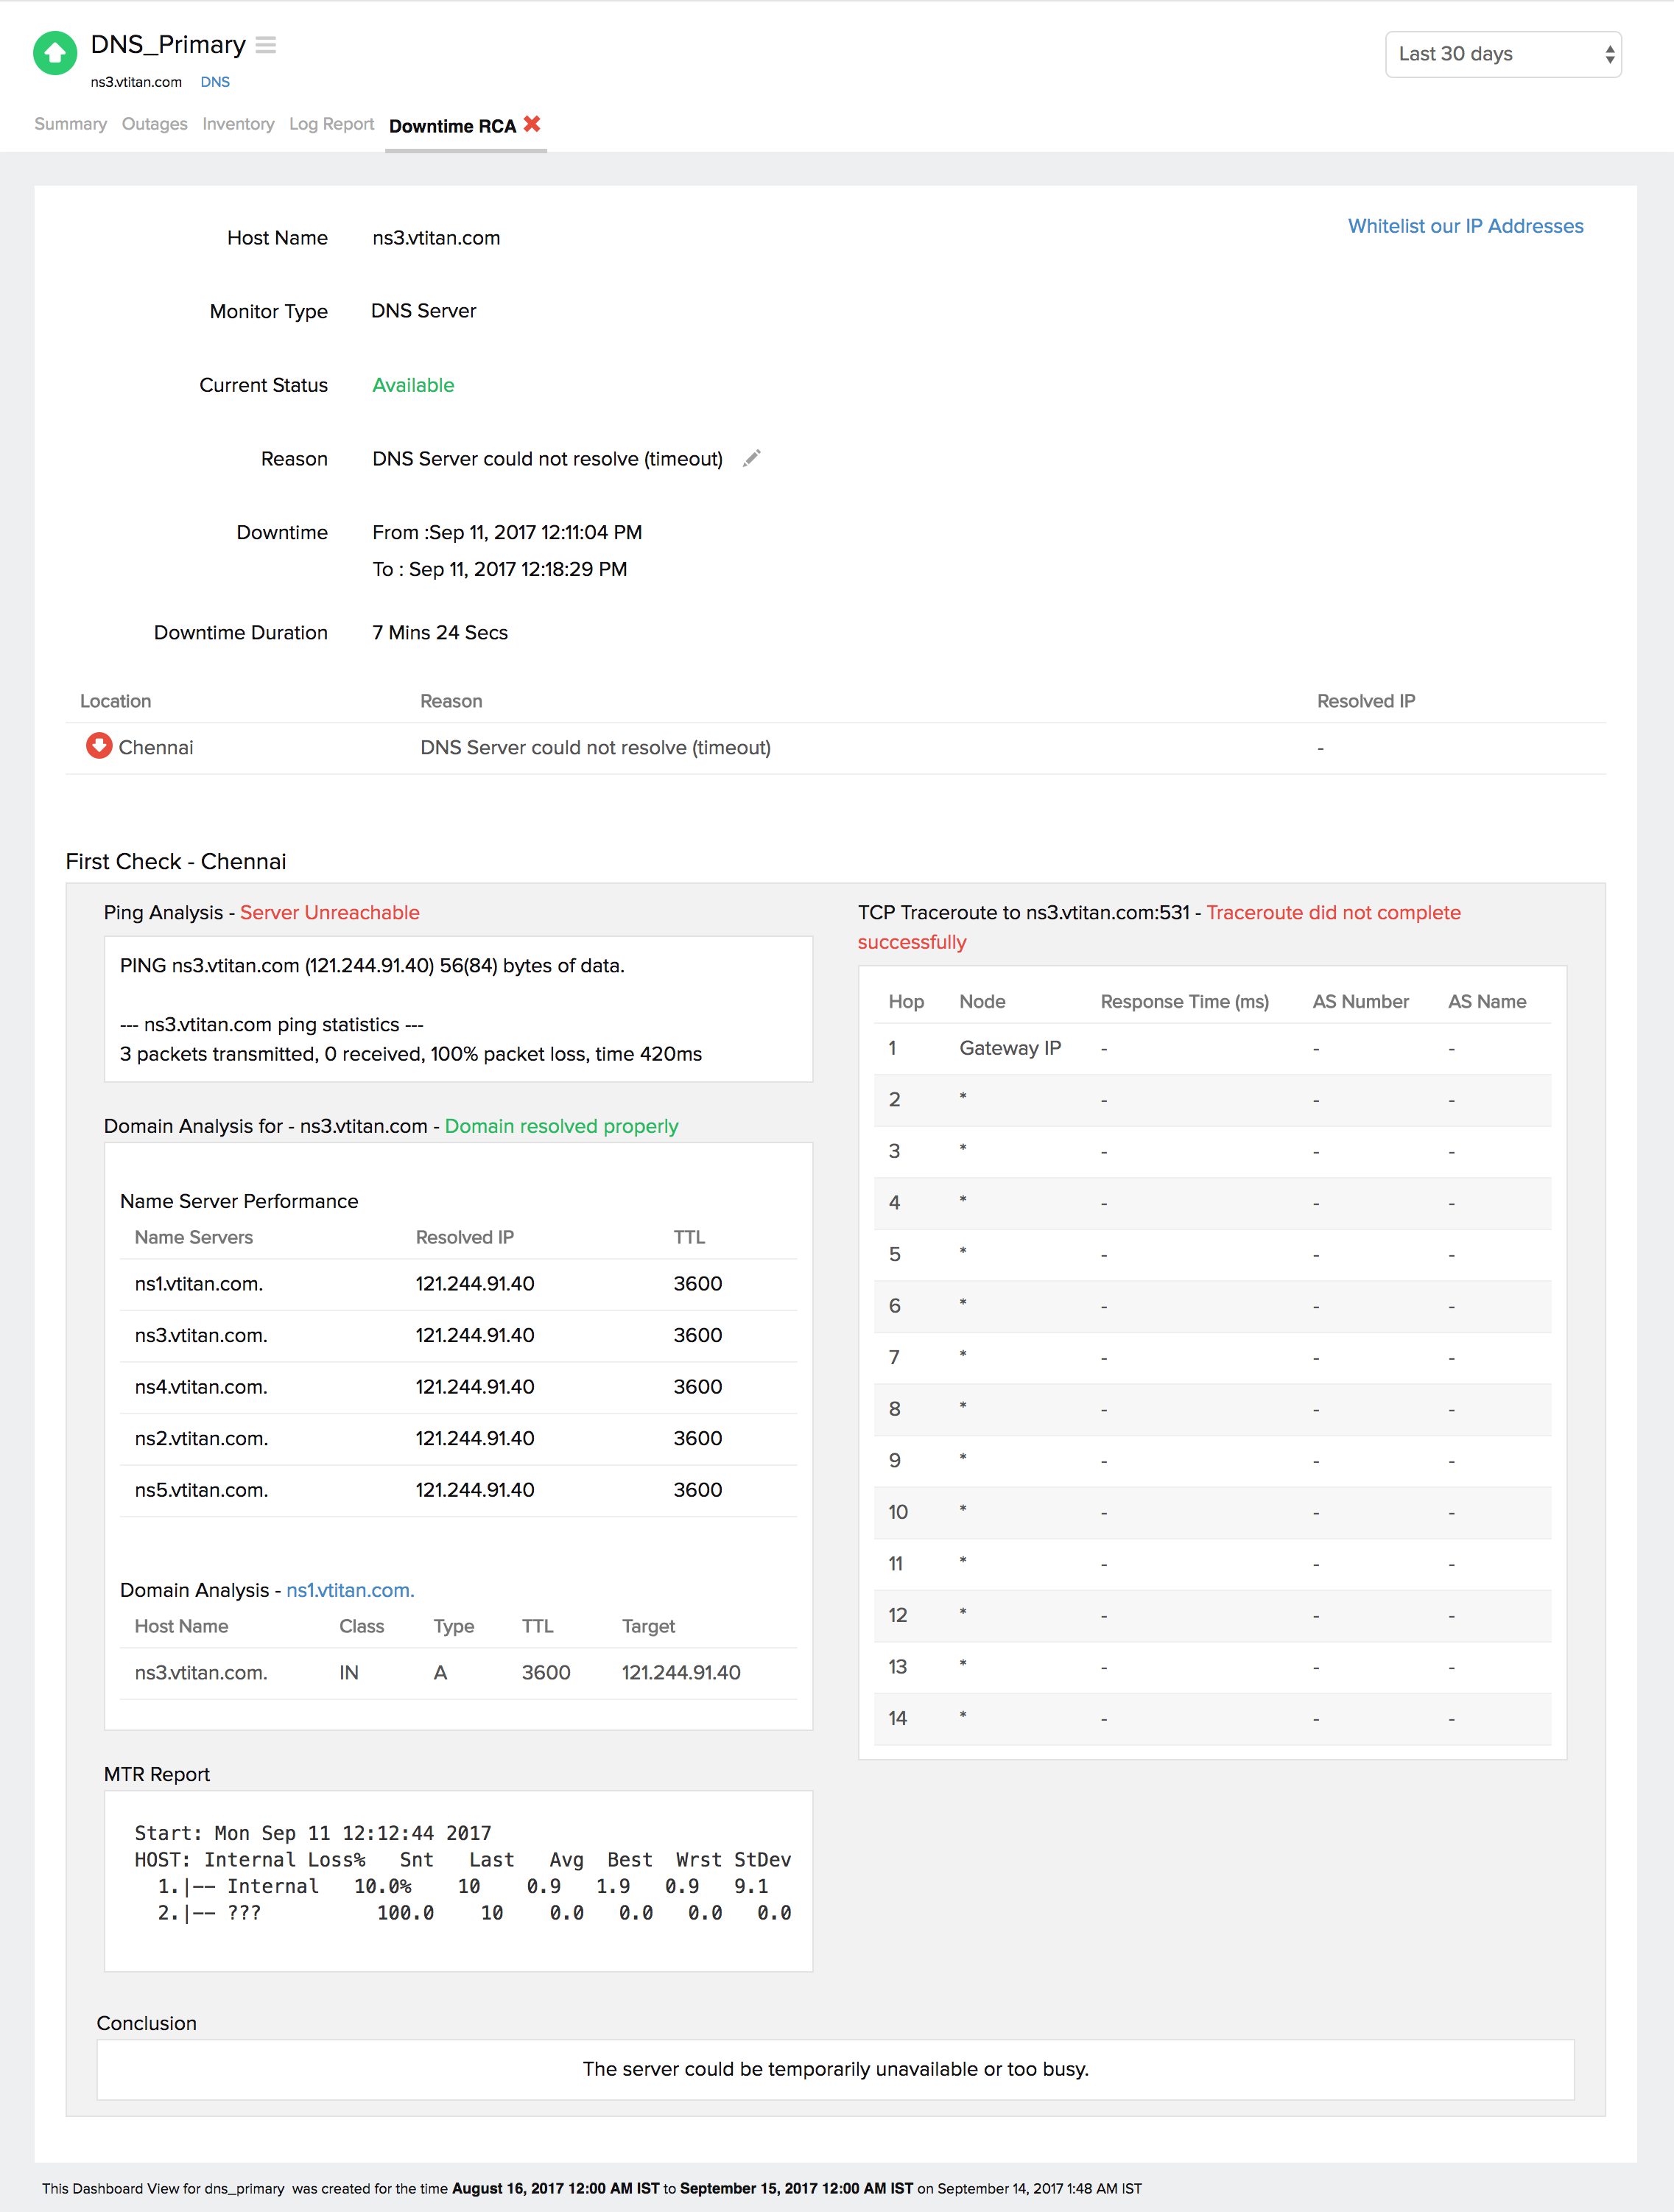
You can retrieve indepth root cause analysis report for your DOWN monitors after 150 seconds of the monitor reporting the outage. RCA Report gives basic details about your monitor, outage details, recheck details and reasons for the outage. Root Cause Analysis automatically generates a plethora of information to arrive at a definite conclusion as to what triggered a downtime. RCA intends to determine the root cause of specific downtime or performance issue. A normal RCA report will comprise of the following details:
- Checks from Primary location and re-checks from Secondary location.
- Ping Analysis
- DNS Analysis
- TCP Traceroute
- MTR Report
- View Record Comparison
- MTR based Network Route
- Conclusion
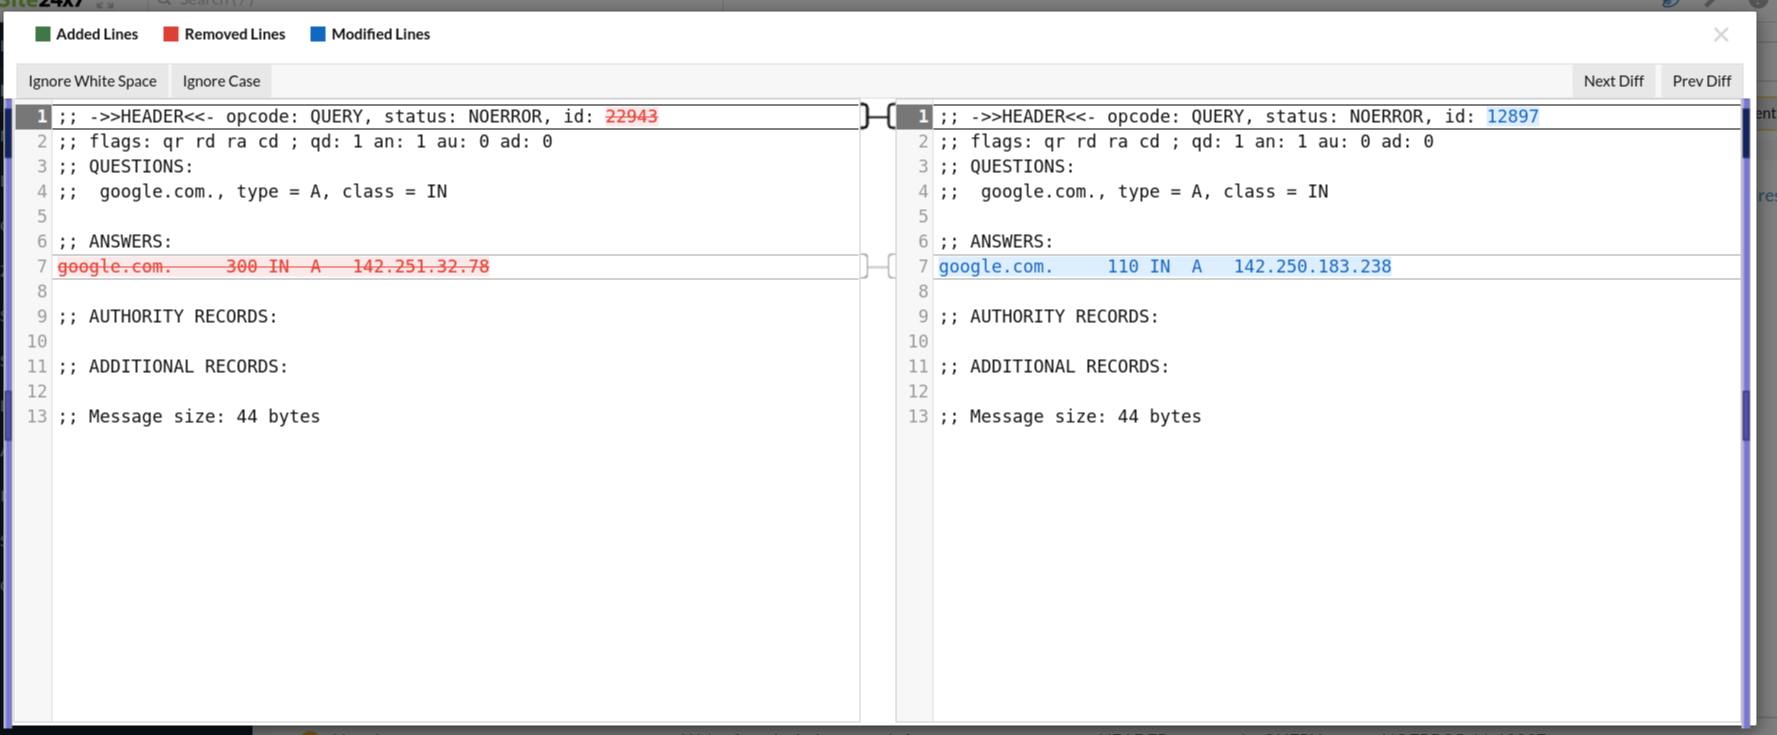
View Record Comparison
You can now view your records and compare them at one place using this option. Click the View Record Comparison link to analyze the records.
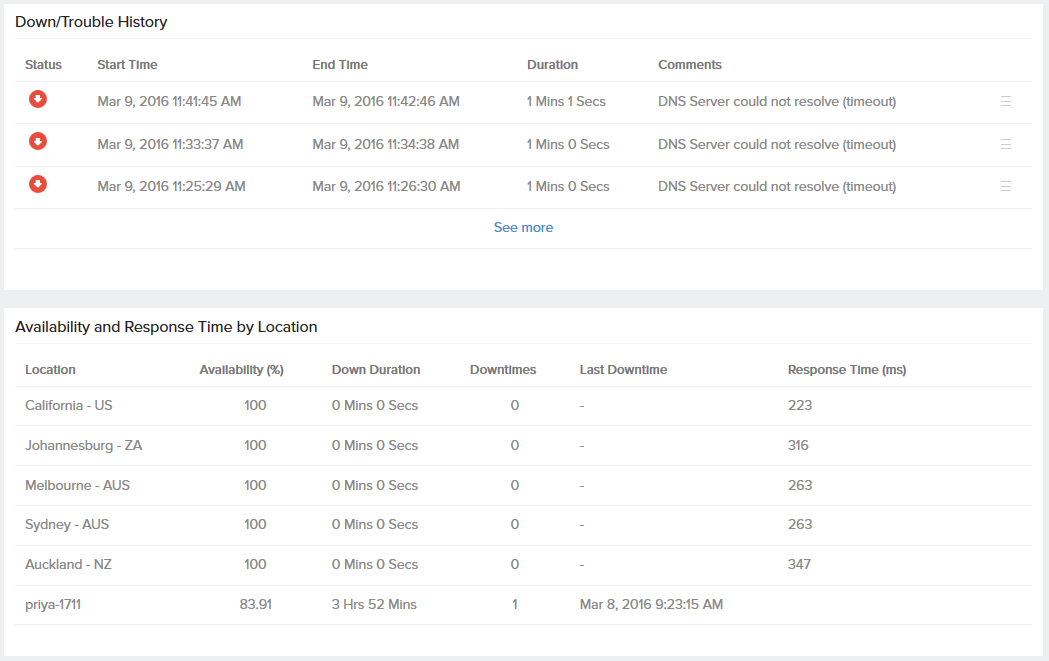
Availability & Response Time by Location
Attributes like Availability and Response Time of the DNS server from each monitoring location is shown in a tabular format. The total availability percentage, Response Time (ms) and down duration from each monitoring location can be inferred from this report.
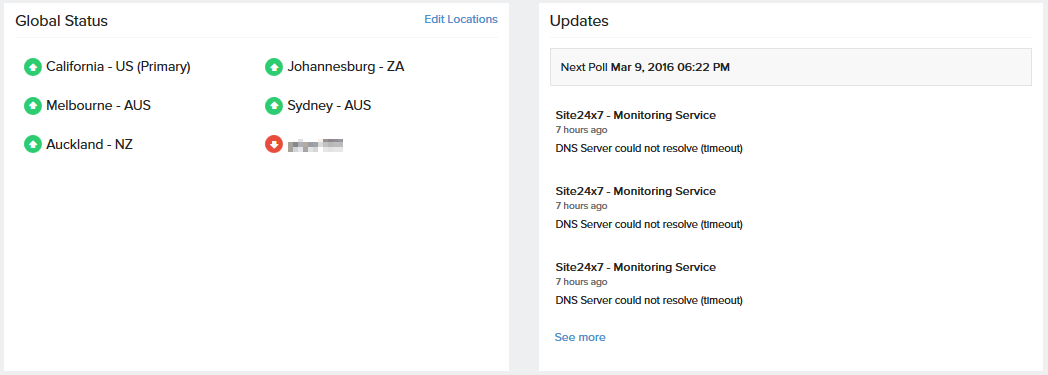
Global Status and Updates:
Get an instant peek into the actual real-time status of your monitor from the configured geographical locations. Additionally, you can also view the real-time data from the various poll cycles and it includes the outages and trouble alerts data.
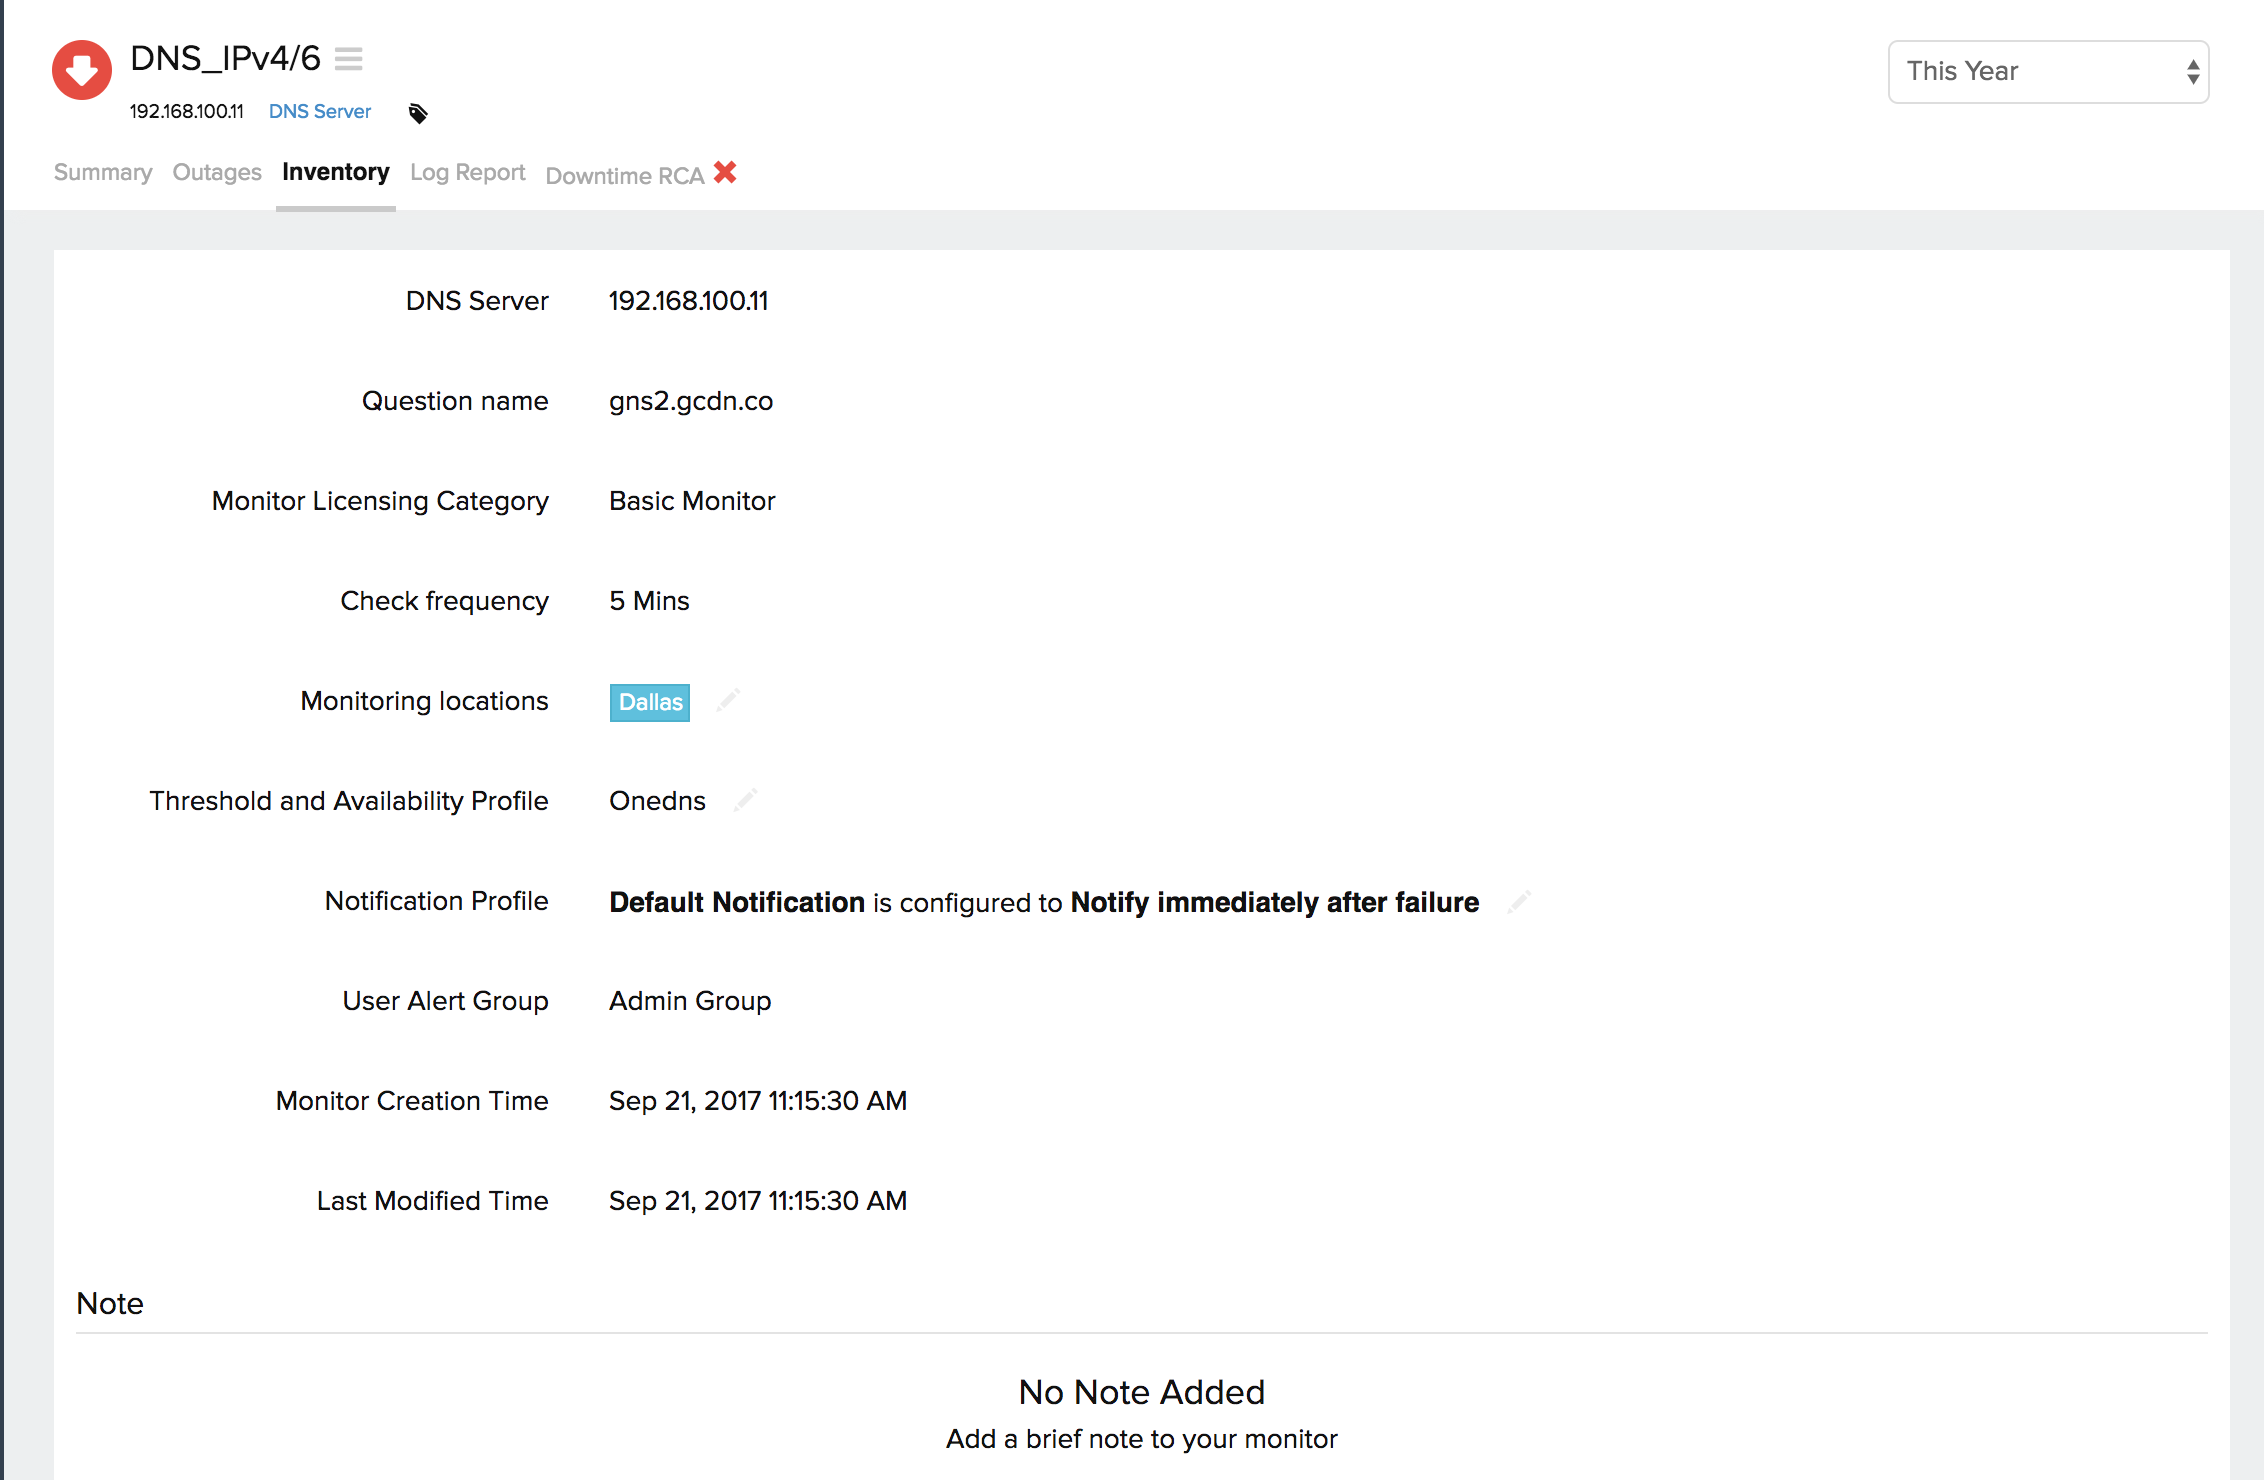
Inventory and Notes:
This section captures the basic monitor information and also its various configuration settings including polling locations, poll interval, licensing type, and more.
Log Report:
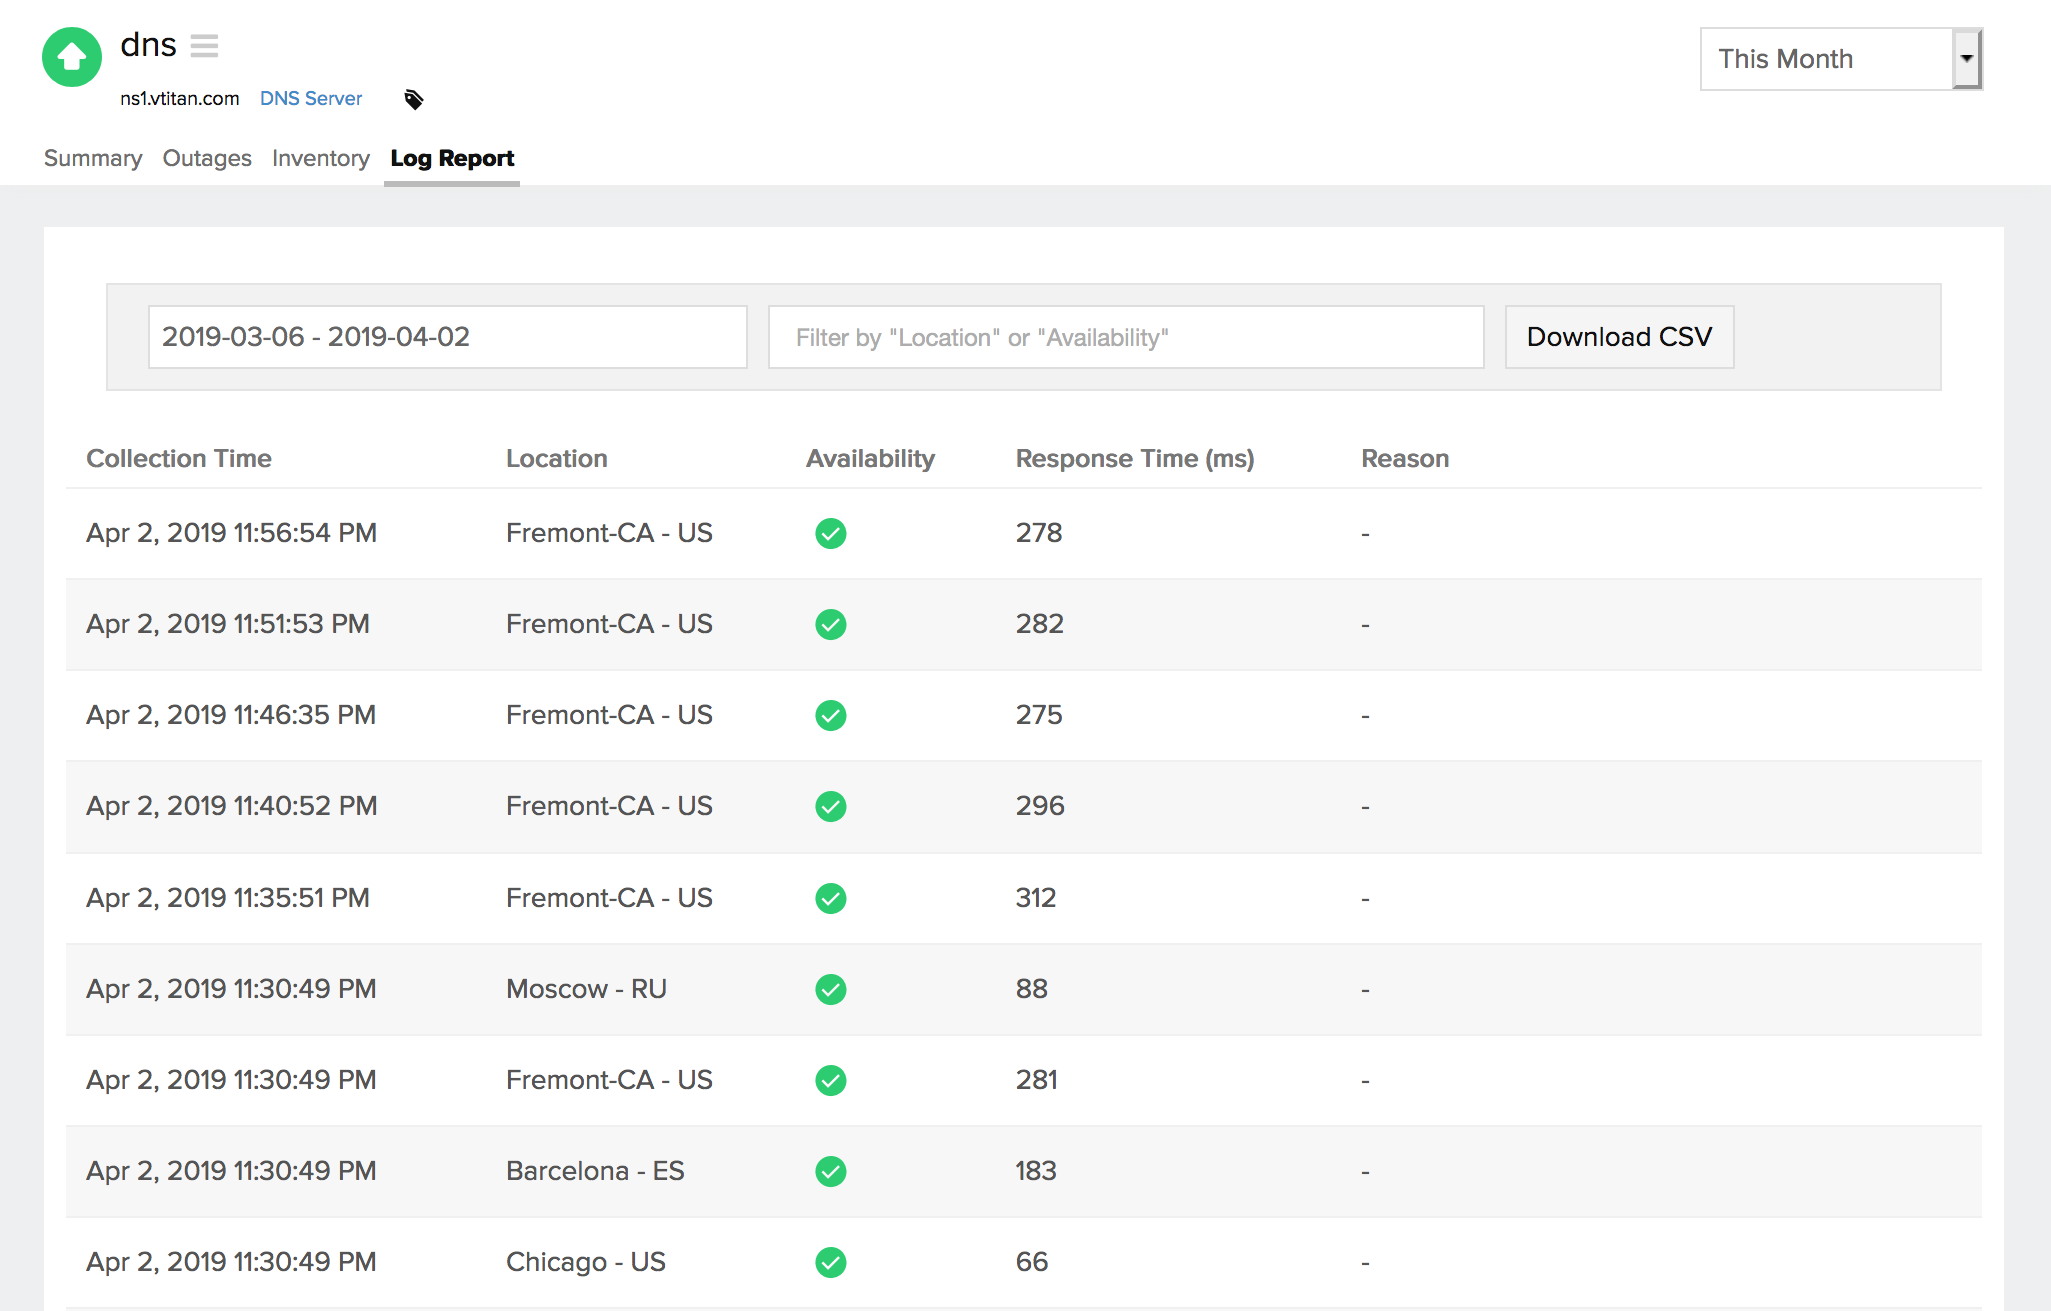
With our integrated log records for individual monitors, you can get an indepth knowledge about the various log details for the configured monitor, over a custom period. You can also filter the log based on location and availability. You have an option to download the log report in CSV format.
Learn more: How to set up a DNS Server Monitor?
