Django Logs
Django is a Python-level web framework used to build applications easily and instantly. Django provides logging using Python's logging module, which can be easily configured. Site24x7 AppLogs natively supports Django logs. Get more information from these logs using Site24x7 AppLogs.
Getting started
- Log in to your Site24x7 account.
- Download and install the Site24x7 Server Monitoring agent (Windows | Linux).
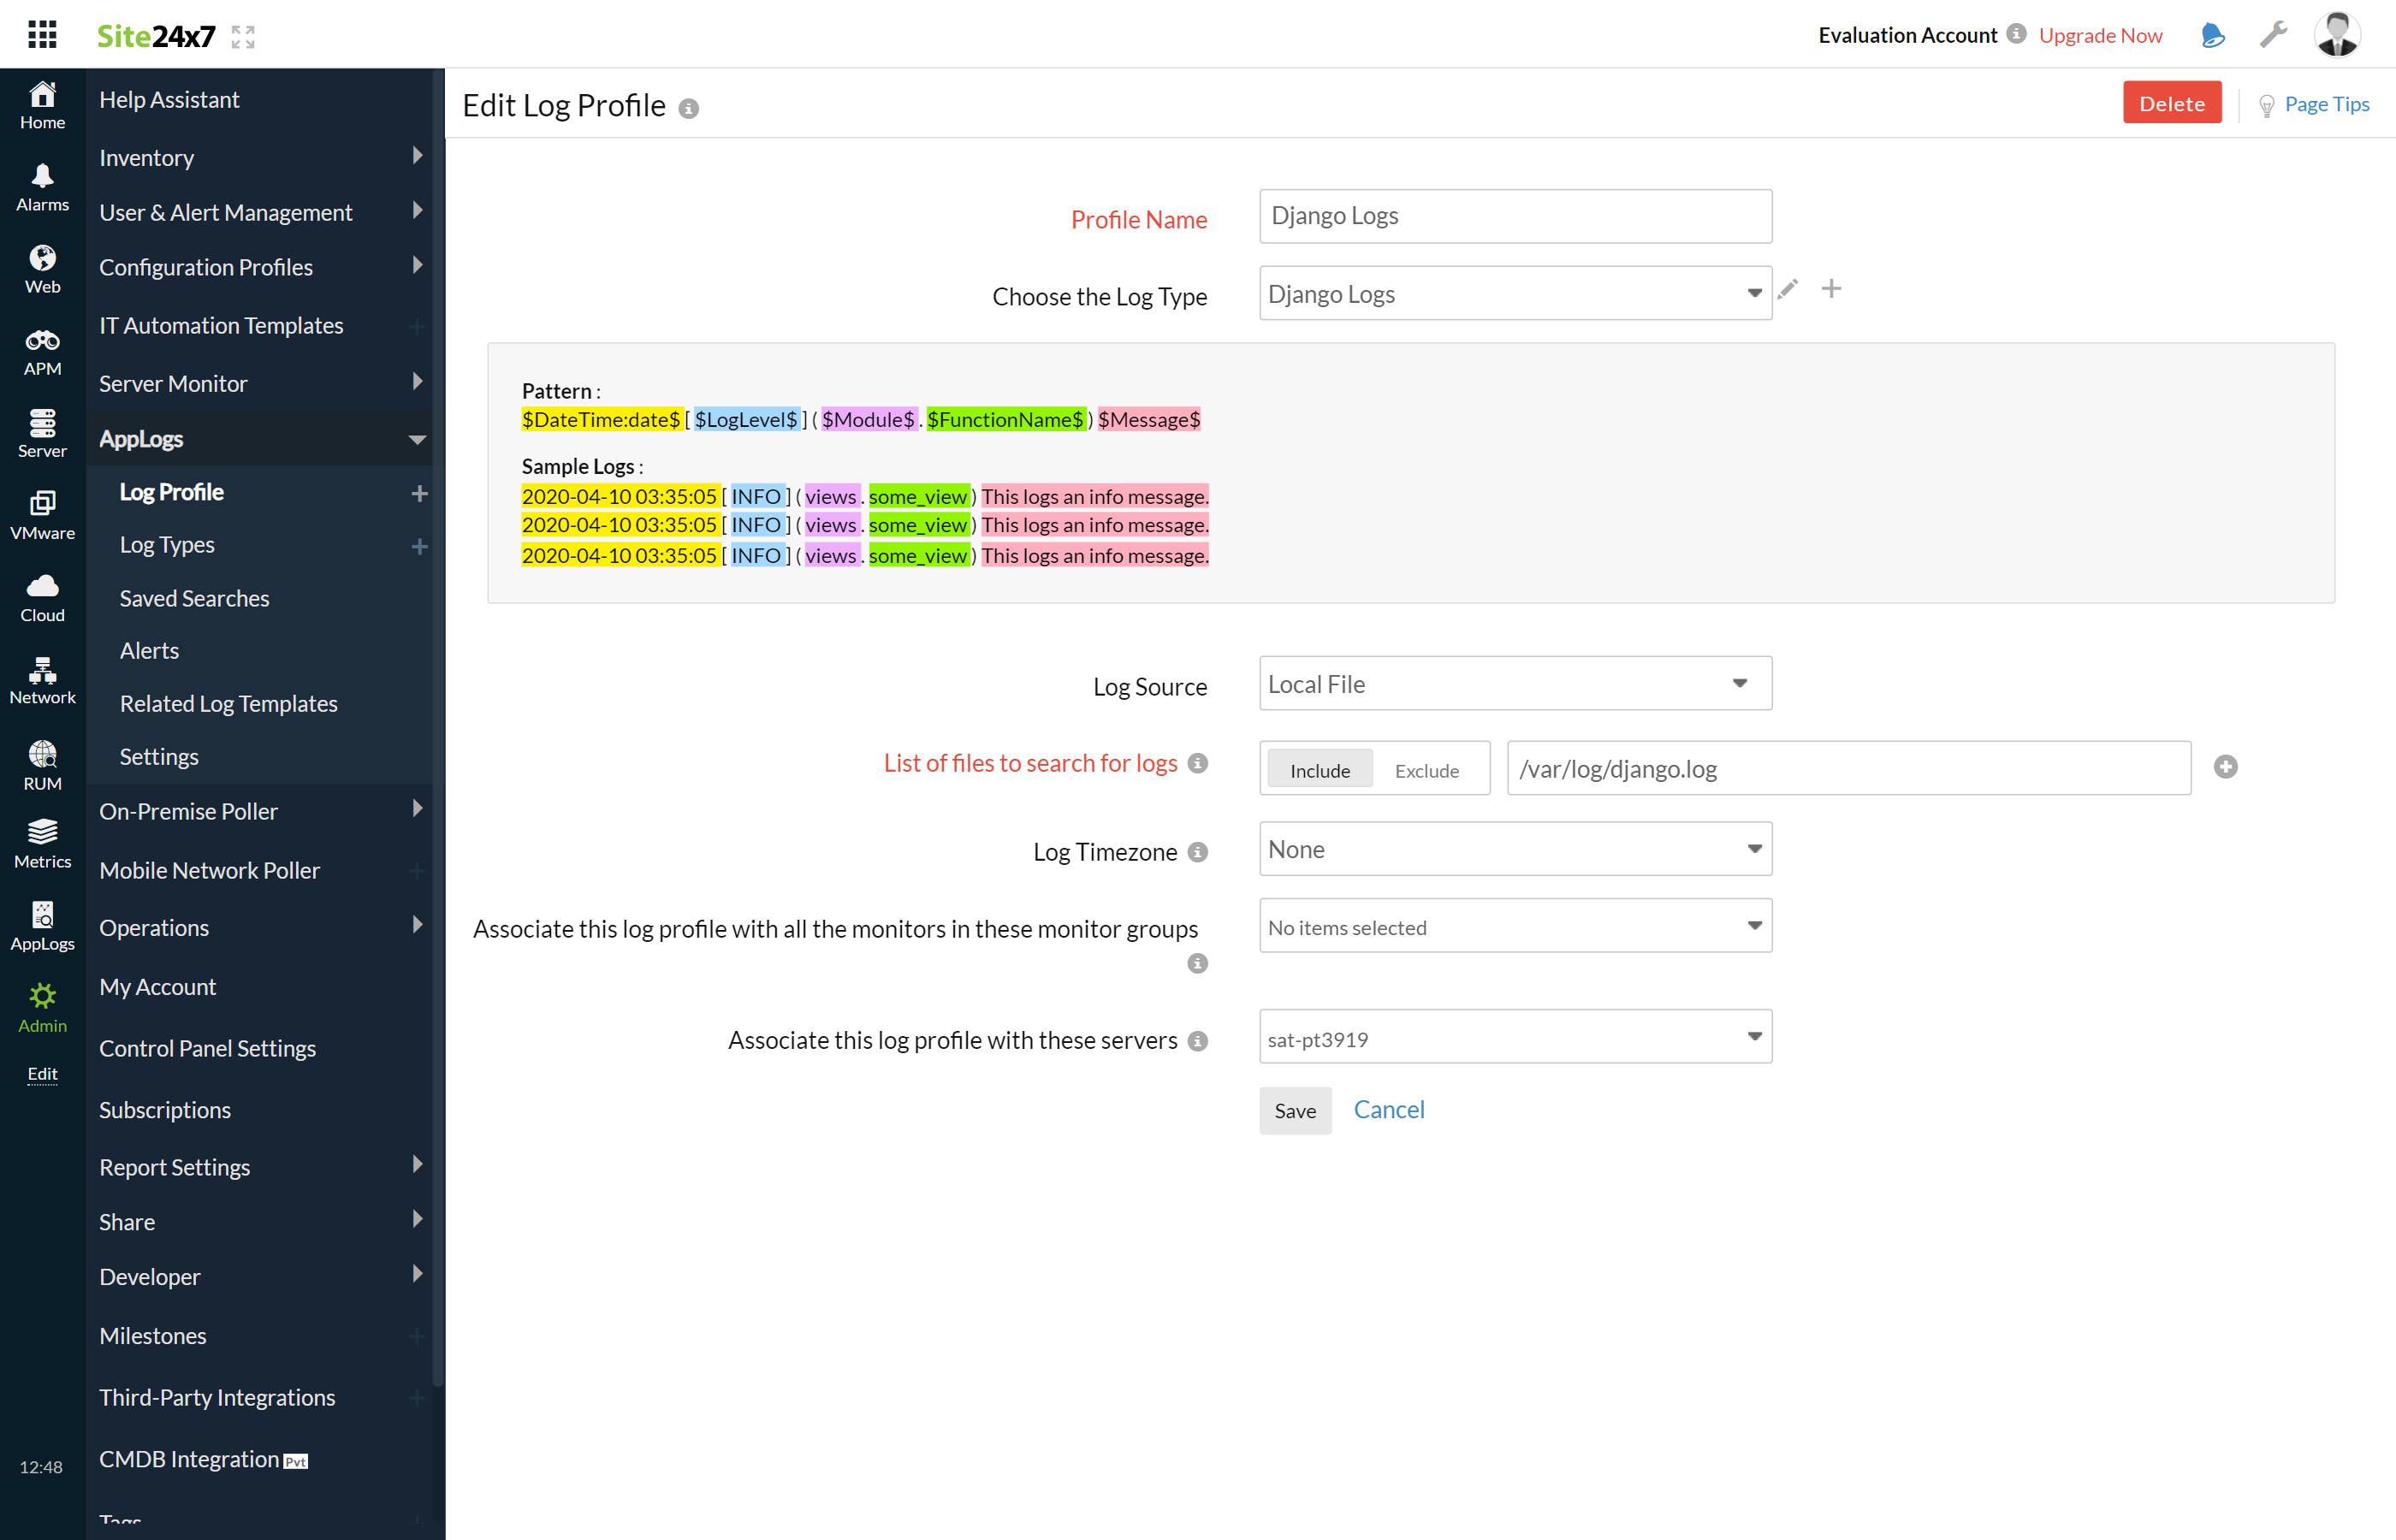
- Go to Admin > AppLogs > Log Profile and select Add Log Profile.
- Enter the Profile Name.
- For Choose the Log Type, select Django Logsfrom the drop-down list.
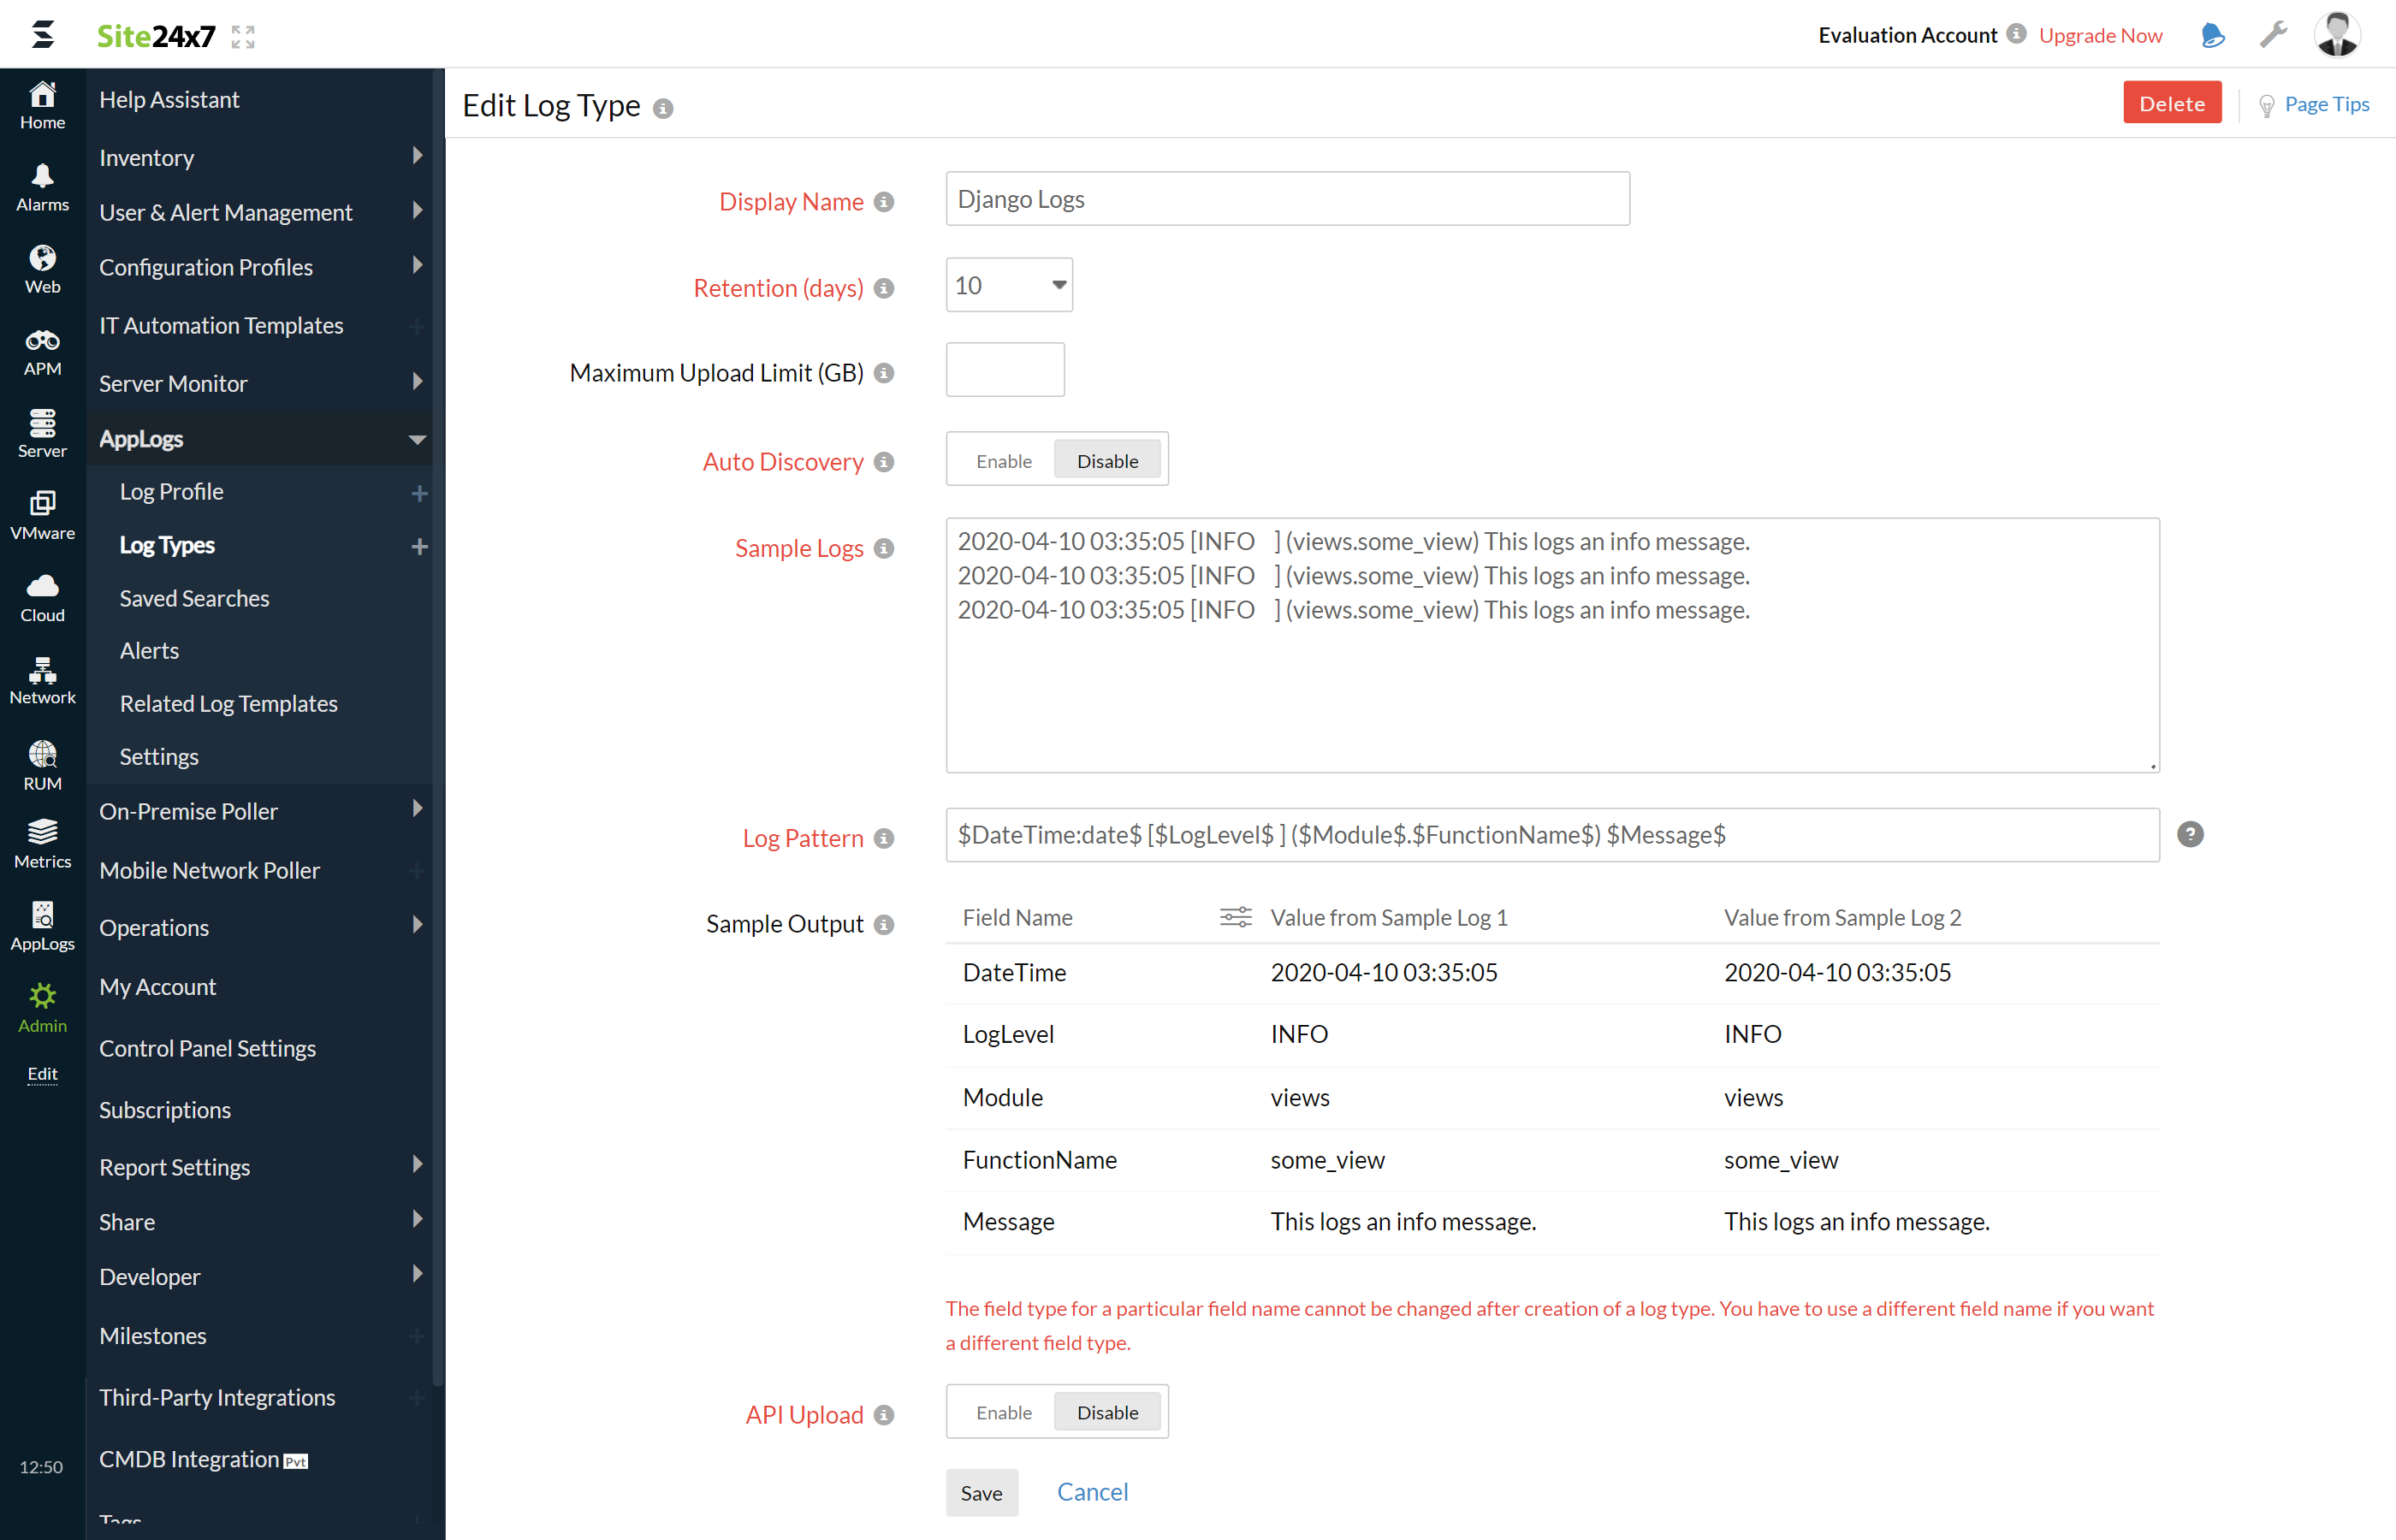
The Pattern and Sample Logs are displayed below.
Sample Logs:
An info message: 2020-04-10 03:35:05 [INFO] (views.some_view)
A warning message: 2020-04-10 03:35:05 [WARNING] (views.some_view)
An error message: 2020-04-10 03:35:05 [ERROR] (views.some_view)
A severity message: 2020-04-10 03:35:05 [SEVERE] (views.some_view) - This log is separated into fields, each of which takes its respective value and is then uploaded to Site24x7.
- By default, this is the log pattern identified by Site24x7 AppLogs for Django logs:
$DateTime:date$ [$LogLevel$ ] ($Module$.$FunctionName$) $Message$
5.You can also add a custom Log Pattern instead of the default one. To do so, click the pencil icon and specify your pattern.

6. Select the Log Source. By default, the paths below are used as a file source:
Linux: "/var/log/django.log"
7. If your source path is different from the default path, specify it while adding the Log Profile.
8. You can also associate this Log Profile with monitors, monitor groups, or corresponding servers.

9. Click Save.
Dashboard
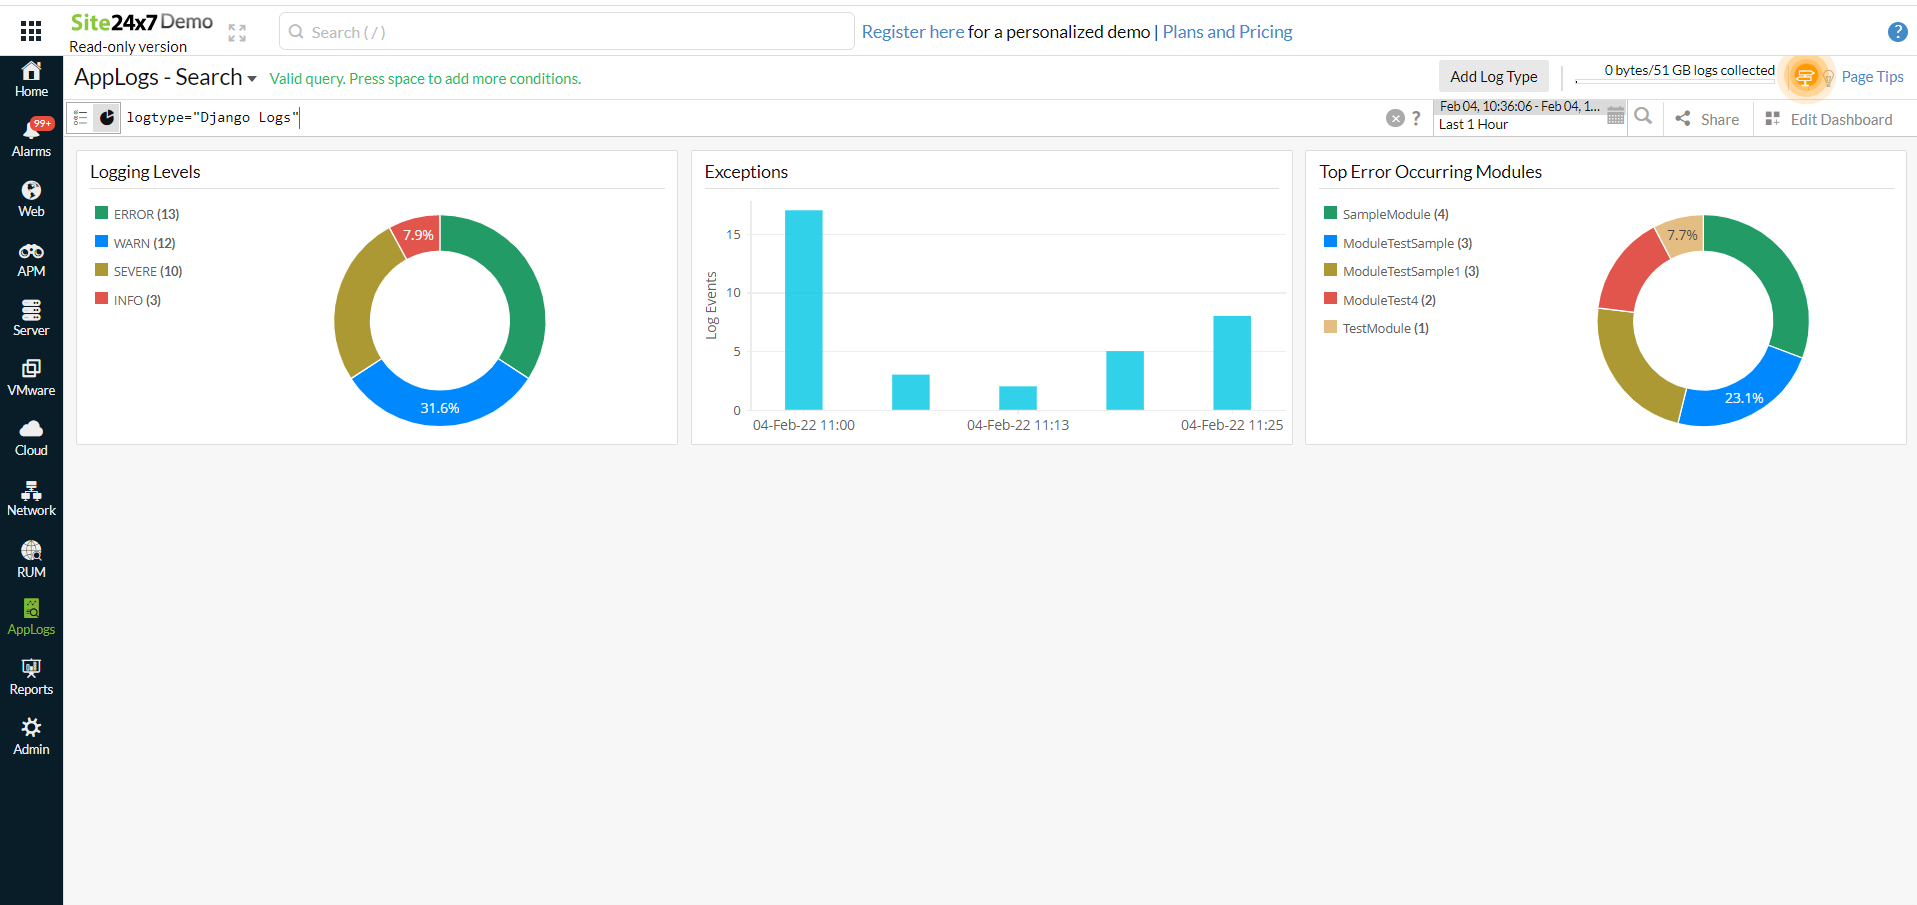
AppLogs creates an exclusive dashboard for every Log Type and shows a few widgets by default. Here's a list of the widgets available in the Django logs dashboard:
- Logging Levels
- Exceptions
- Top Error Occurring Modules

Related log types:
-
On this page
- Getting started
- Dashboard
- Related log types
