Summary Report
Summary Report is a comprehensive report that offers critical insight into metrics like overall availability, outage details, availability and suspended summary of your configured monitors or tagged monitors. You can gain a clear perspective of the performance of your monitors and identify areas that need improvement. The availability and performance metrics displayed is always based on the data tracked from your primary location.
Generate Summary Report
- Log in to Site24x7.
- Navigate to Reports > Choose the monitor type > Summary Report.
Note
You can either generate a summary report for a selected monitor or a consolidated report for all the monitors.
- Select required monitor from the header drop-down and change the other parameters as per your requirement to obtain a customized report.
- Monitors/Tags: Select the desired monitor from the drop down list. You can also pick a Tag from the drop-down list. On selecting a specific tag, the report will be generated for all the monitors (of that specific monitor type).
- Time Period: Choose the required time period.
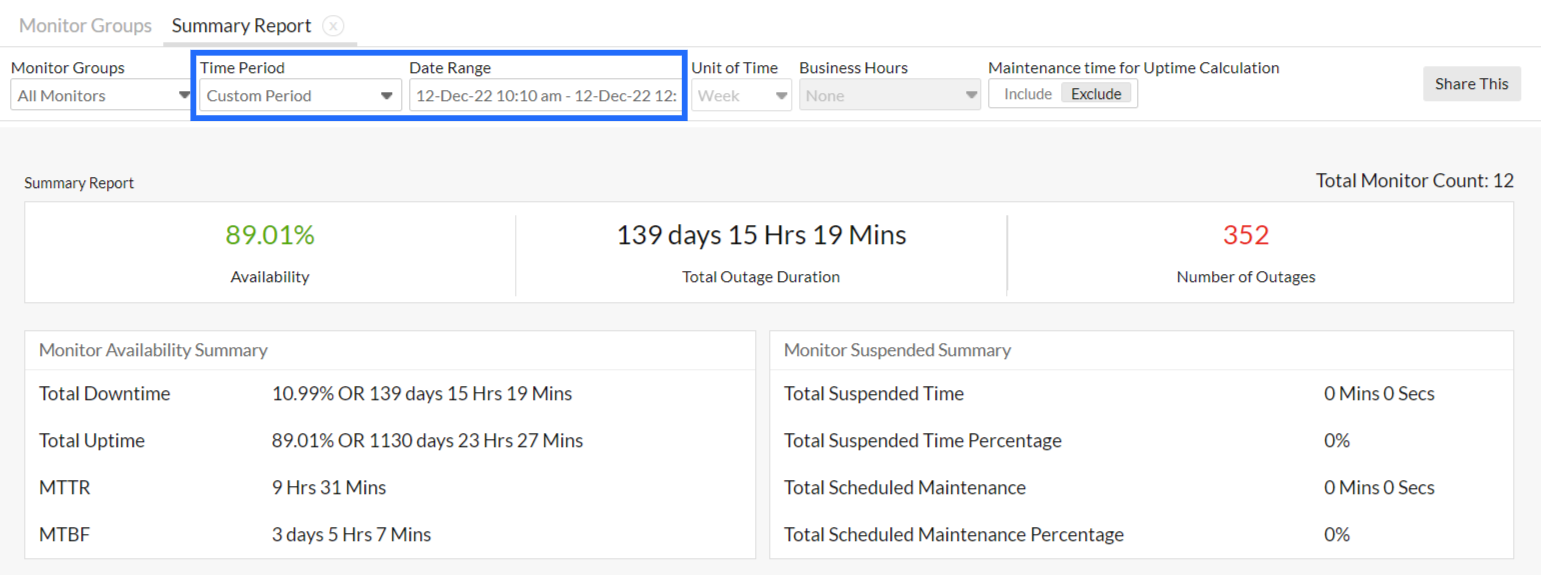
You can generate reports for time periods ranging from the last 1, 6, 12, 24 hours, or up to a year back. Furthermore, you can also obtain reports for custom time periods by selecting the Custom Period option from the Time Period drop-down. Use the Date Range field beside the drop-down to select the preferred date and time, and click Apply.
- Unit of Time: Choose different unit of time for different time period.
NoteLearn more about granularity supported for each time period.
- Business Hours: Select the time period that is most critical to your business.
- Maintenance time for uptime calculation: You can include / exclude maintenance time from the monitor's uptime calculation.
- Once the report is generated, click "Share This" button on the top right corner.
- Publish Report: Click publish report and populate the form. This creates a permalink that would make the report accessible to customers without a login.
- Email: Share the report via an email. Email can be sent to only those verified users who have agreed to receive emails from Site24x7.
- Export CSV: Export the report as a CSV file.
- Export PDF: Export the report as a PDF file.
- Schedule Report: Populate the schedule report form, to create a report task that would trigger summary report mails to the customer.
Interpret Summary Report
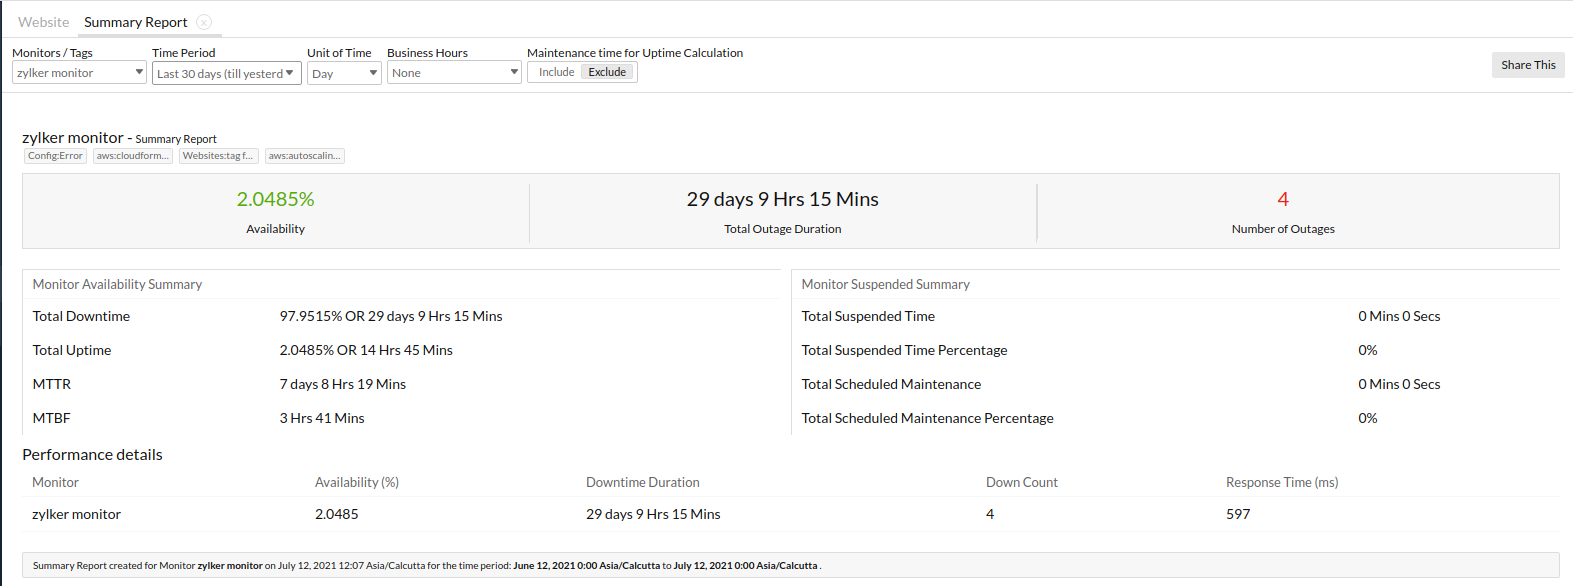
Summary Report for the selected monitor/tag gives you a lucid account of the monitor's availability and performance. The top band provides visibility on the metrics like cumulative availability percentage, total outage duration and the outages count of the selected monitor, for the chosen time period.

Fig.1. Website Monitor: Summary Report for the Last 30 Days

Fig.2. Website Monitor: Summary Report for This Year

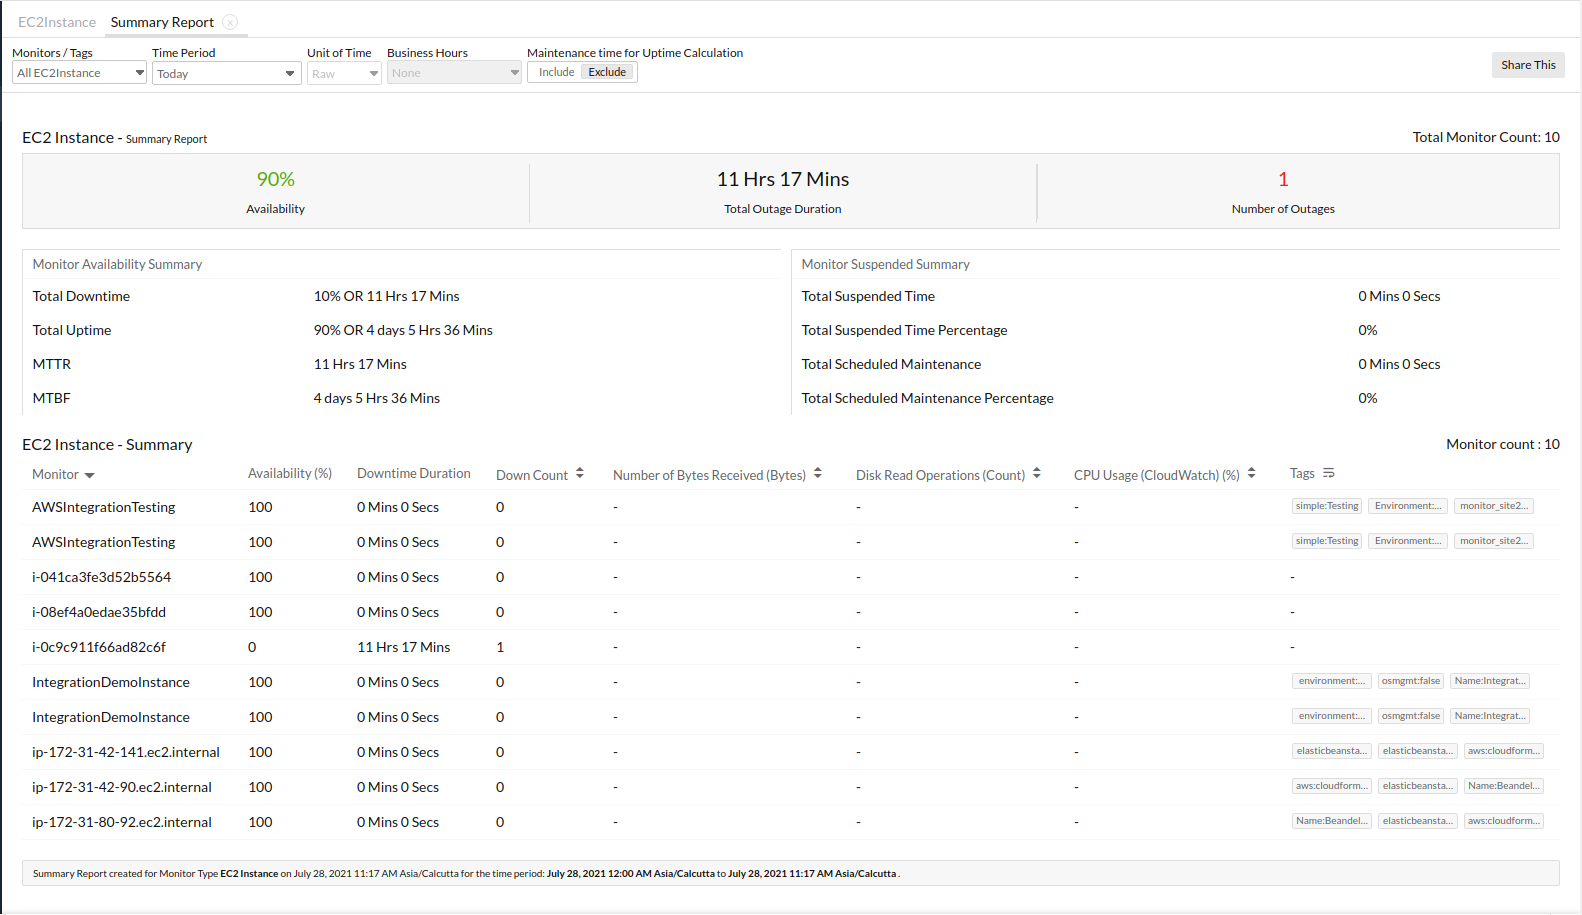
Fig.3. AWS Monitor: Summary Report for a day
Monitor Availability Summary
Detailed summary of downtime/uptime is presented in a tabular format. The detailed parameters are described here:
- Total Downtime: The monitor's cumulative downtime for the selected time period is represented in terms of percentage or time.
- Total Uptime: The monitor's cumulative uptime for the selected time period is depicted in terms of percentage or time.
- Mean Time to Repair (MTTR) - The average time to repair a device or a system back to acceptable operating conditions. The term can also mean, the time spent to restore a machine to operating condition after failure. This must be as low as possible.
- Mean Time between Failures (MTBF) - The average time that a device or a system worked without failure. The term can also mean the length of time a user may reasonably expect a device or system to work before an incapacitating fault occurs. This must be as high as possible.
Monitor Suspended Summary
Unavoidable monitor suspensions and pre-planned scheduled maintenance activities consume a chunk of downtime activity. This data is segregated from downtime and presented in a tabular format for better clarity.
- Total Suspended Time: Any downtime captured due to unscheduled suspension of the monitor.
- Total Suspended Time Percentage: The cumulative downtime percentage due to the unscheduled suspension of your monitor.
- Total Scheduled Maintenance: The cumulative time consumed by all the pre-planned maintenance activity during the monitoring period.
- Total Scheduled Maintenance Percentage: The total percentage of cumulative scheduled maintenance activity carried out during the specified monitoring period.
Performance Details
Summary Report helps you to have a more detailed performance analysis of your configured monitor/ all monitors associated to that Tag. Based on the chosen monitor type (agent based/agentless monitor type) and time period–the lead performance indices, which are captured from your chosen primary monitoring location–is rendered in a tabular layout. Additionally, parameters like the Availability percentage and Downtime Duration for the monitor are also displayed. For internet facing monitors like website, ping, DNS monitors–the captured metric is usually the response time (in ms) of the monitor. However, for agent based monitors like the Server monitor–the metrics captured range from the CPU percentage, Memory percentage and Disk usage percentage of the Server.
View related reports:
