Performance Metrics for Monitoring Linux Servers
Monitor and measure critical metrics like CPU, memory, disk utilization, processes, and network traffic of Linux servers from a unified dashboard. Once the Linux agent is successfully installed, log in to the Site24x7 web client and navigate to Server > Server Monitor > Servers > click on the newly added monitor to view their performance metrics.
The Linux agent sends data to the Site24x7 data center using WMI queries. As the agent has to be downloaded and installed in your servers, learn more on how secure the agent is.
- Summary
- Processes
- CPU
- Memory
- Disks
- Network
- Plugins
- Checks
- Syslogs
- Tools
- Add custom tab
- Root cause analysis (RCA) | Performance reports | Server inventory & health dashboards
- Licensing
Summary
Get visibility of all the important parameters of your Linux server performance in a single console. The heat map analysis gives you a quick summary on the status and performance of your server over the last seven days.
Click the icon ![]() to view the Performance Report for metrics including CPU, memory, disk utilization, and more. You may also view performance data for specific time periods, by choosing the appropriate time period from the drop-down at the top right corner of the page. You can export the performance details as CSV/PDF or send via email.
to view the Performance Report for metrics including CPU, memory, disk utilization, and more. You may also view performance data for specific time periods, by choosing the appropriate time period from the drop-down at the top right corner of the page. You can export the performance details as CSV/PDF or send via email.
Load Average
Load average is the average system load over a period of time. Data on load average gives an idea if your physical CPUs are over utilized or under utilized. In case of overload, you may check on any process that’s wasting resources, provide more hardware resources, or move some of the workload to another system.

CPU Utilization
Regular monitoring of CPU usage is critical to analyze the CPU load over a stipulated period of time and overcome performance regressions.
However, not all high CPU usage is critical. The feature to view reports based on the time period proves useful to identify the CPU usage that is really problematic. This will help you to drill down to the actual reason causing the CPU spike. Based on the analysis, you can come up with solutions like upgrading the CPU hardware, adding more CPU’s, or shutting down frivolous services that are hogging these critical resources.
CPU utilization is calculated using the 'top'command. Learn more
|
CPU Utilization = 100 - idle time |
Also, view the top five processes consuming CPU for a particular point of time by hovering on a particular point in the CPU Utilization graph. The top process data is calculated using the Python module 'psutil'.
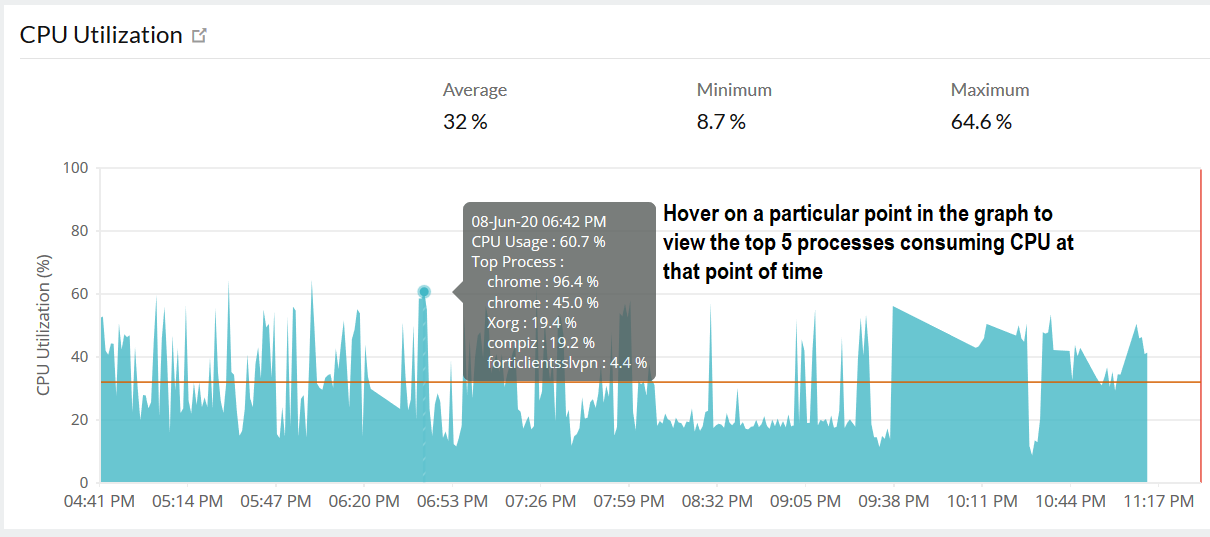
The performance report for CPU usage can be accessed by clicking the ![]() icon beside the title. The report includes:
icon beside the title. The report includes:
- CPU utilization by cores
- Interrupts - Average number of hardware interrupts that the processor is receiving.
- Context switches - Rate of switches from one thread to another. Thread switches can occur either inside of a single process or across processes.
- CPU metrics - User space time, hardware interrupts time, idle time, software interrupts time, nice time, wait time, steal time.
- Average CPU usage (%) per minute.
Navigate to the CPU tab to view more metrics.
Memory Utilization
Monitoring memory usage helps you to identify under used servers and redistribute loads effectively. This helps to detect server overloads before they cause a downtime or data loss.
Memory usage is calculated using the 'free' command. Learn more.
|
Memory Utilized = ( ( Total - Free ) / Total * 100 ) |
Also, view the top five processes consuming memory for a particular point of time by hovering on a particular point in the Memory Utilization graph. The top process data is calculated using the Python module 'psutil'.
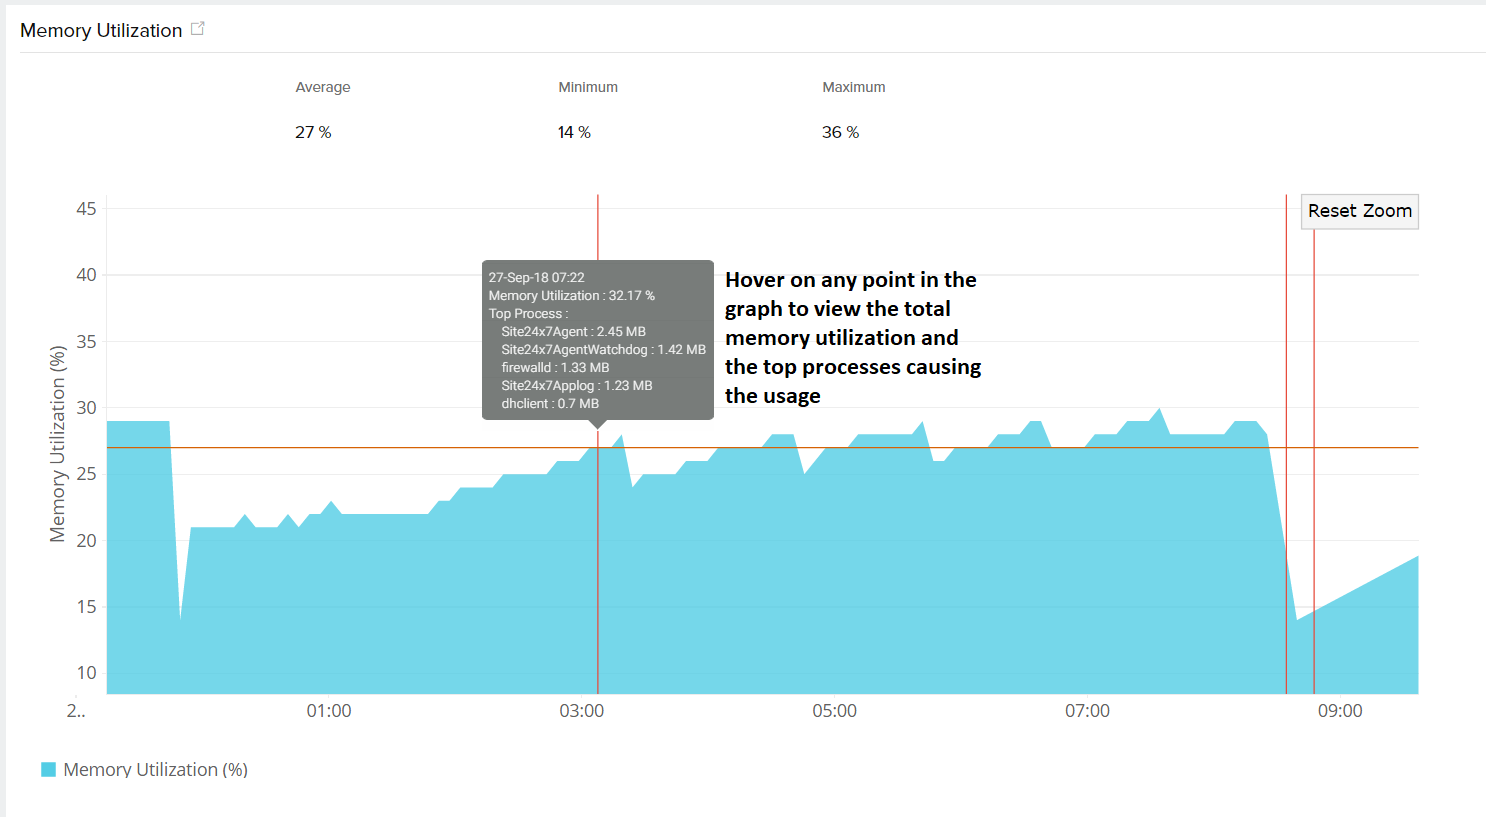
The performance report for memory usage can be accessed by clicking the ![]() icon beside the title. The report includes:
icon beside the title. The report includes:
- Swap memory utilization
- Memory used
- Memory break up for free physical and free swap memory.
- Memory Pages In - Number of pages read from disk to resolve hard page faults.
- Memory Pages Output - Number of pages written to disk to free up space in physical memory.
- Memory Page Fault (per second) - A page fault occurs when a process requires code or data that is not in its working set (its space in physical memory). Know how this metric is calculated and shown in the Site24x7 web client.
- Average memory usage (%) per minute.
Navigate to the Memory tab to view more metrics.
Memory Breakup
Get a split up of the free physical memory and free swap memory available in the server. The less used files can be moved to the swap space until they are needed and new files can be swapped to the RAM. This helps to better plan and allocate resources to avoid server overload and data loss.

Navigate to the Memory tab to view more metrics.
Open File Descriptors
This metric shows you the number of unique identifiers showing the number of open files and active input/output resources linked to the Operating System of the device. Knowing this critical data ensures optimal resource utilization since open files mean resource consumption like kernel data structures and memory.
Disk Usage with Capacity Plan
Get an idea of what your disk usage will be after seven days, based on your current disk usage. If the disk usage and predicted value are irregular or show a sudden spike, then it means there is some performance degradation issue in the usage and definitive action is required. Go to the Disks tab and check for the disk utilization of each partition and resolve the issue before it affects the overall performance of your server.
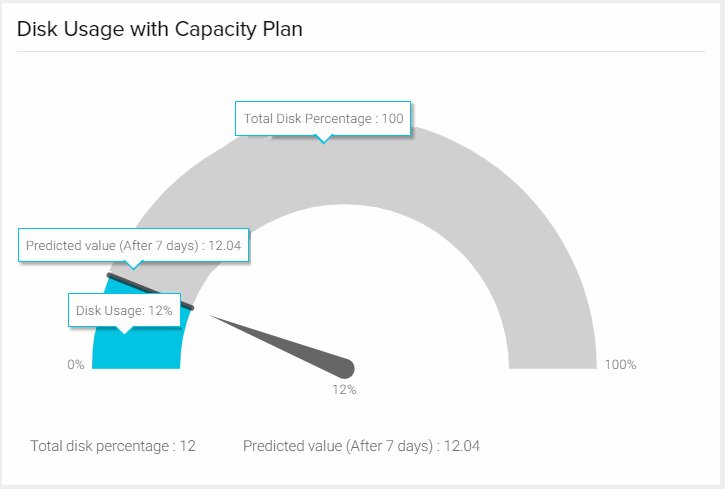
Navigate to the Disks tab to view more metrics.
Recent Events
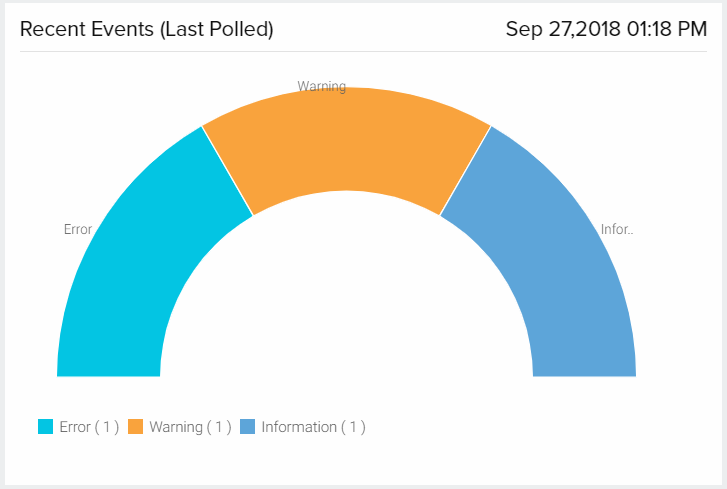
Know the latest events in your server, categorized as Warning, Error, and Information. The data is refreshed after every poll and this helps in getting to know any abnormal increase in the number of error/warning events and take immediate action.
Top Process by CPU and Memory
View a list of top processes based on the CPU or memory usage in your server. Use the toggle button to choose between CPU and memory usage.
Application Details
Applications like docker or plugins that you have installed will be listed along with their respective monitor display names. Click on the monitor name to go to the respective monitor's Summary page.
Down/Trouble History
The complete history of your server's DOWN and TROUBLE status is listed with the duration of the DOWN/TROUBLE period, reason for the outage, and the root cause analysis (RCA) details.
Processes
Monitor the processes running on your Linux server. In case you are unable to find the process that is running on your Linux server, use the Discover Processes option to add them manually.
Find out more about the metrics for process monitoring and the management actions that can be performed. Individual thresholds for every process can be set by using the pencil icon under Action. Learn more.
CPU
Get complete data on the CPU utilization of your server.
| Metric Name | Description |
| User Space Time | The percentage of CPU spent on user processes |
| Hardware Interrupts Time | The percentage of CPU servicing hardware interrupts |
| Idle Time | The percentage of CPU spent in idle state |
| Software Interrupts Time | The percentage of CPU servicing software interrupts |
| Nice Time | The percentage of CPU processing low priority processes |
| Wait Time | The percentage of CPU waiting on I/O operations |
| Steal Time | The time stolen by the Hypervisor host to use it on the other virtual machines |
| System Time | The percentage of CPU spent on system processes |
| Interrupts and Context Switches | Average number of hardware interrupts that the processor is receiving and the rate of switches from one thread to another |
| CPU Utilization by Cores | The CPU utilization for all your central processing units or cores. |
Memory
Get complete data on the memory utilization of your server.
| Metric Name | Description |
| Swap Memory Utilization | The total swap space available in the server (in percentage) |
| Memory Used | Total memory used by the server (in Bytes) |
| Memory Breakup | A split up of free physical and free swap memory |
| Memory Pages (In/Out/Fault) | Number of pages read from, written to the disk respectively, and the number of page faults |
The metric memory page fault per second is calculated from proc system using the following command:
cat /proc/vmstat
To cross check the value shown in the Site24x7 web client, execute the following command in your terminal. It would give the page fault value since the server was booted. This is shown as a per second value in the Site24x7 web client.
cat /proc/vmstat | grep -i 'pgpgin\|pgpgout\|pgfault'
Disks
Closely monitor the disk usage and have a regular check on the availability of disk space in your servers. Check out the server disk partition report to view the used and free disk space across servers in your account.
| Metric Name | Description |
| Disk Partition Details & Usage Forecasting | A tabular view of the used and free disk space (in MB and percentage). Click on the values to go to a detailed performance report for each partition. Click on the pencil icon under Action to set thresholds for each of these partitions. You can also choose to Skip Alert for any partition using the pencil icon. |
| Average Disk Utilization (%) | The free and used disk space (in percentage) available in your server |
| Disk (I/O) | The read and write operations performed in the disk |
| Partition Disk I/O | The read and write operations performed in every partition |
| Overall Disk Utilization | The total disk usage and free space available in GB |
| Current Individual Disk Utilization (%) | The most recent (last polled) utilization of individual disk partitions |
| Disk Idle and Busy Percentage | Know how much of your disks are being used to avoid overloading. If the busy time is high, then it refers to overload and that allocation of resources in your server is not done optimally. Note: The Linux monitoring agent uses the utility iostat to capture the disk idle and busy percentage. Please ensure the iostat utility is installed in your server. If not, install it in the server and restart the monitoring agent service. |
| Disk IOPS | Displays the total number of input and output operations performed by the disk per second. Please ensure the iostat utility is installed in your server. If not, install it in the server and restart the monitoring agent service. |
| Average Disk Queue Length | Represents the average number of input and output (I/O) requests waiting in the command queue for the disk device. This metric is used for assessing disk performance and responsiveness. Please ensure the iostat utility is installed in your server. If not, install it in the server and restart the monitoring agent service. |
Under Disk Partition Details & Usage Forecasting, click on the Rediscover button to discover disk partitions and add them for monitoring. Click on the Bulk Action button to set thresholds for multiple disk partitions at one go.
If you wish to specify a threshold value for a particular partition, click on the pencil icon beside the partition's name under Action. Multiple threshold values can be set for a single partition for the conditions >, <, =, >=, <= and in Bytes, KB, MB, GB, and TB. You can choose to get a Trouble or Critical alert when a breach is detected.
Learn more on how alerting works when disk utilization thresholds reach beyond their configured values.
Network
In this tab, you can view the following network statistics:
- A graphical representation of Packets Sent, Packets Received, Data Sent, and Data Received.
- Overall network details based on connection type, including:
- Network Interface Name
- Maximum interface speed
- Status
- Data Sent
- Data Received
- Bandwidth usage
- Packets Sent
- Packets Received
- Error packets
- Detailed information for individual network interfaces, including:
- Network Interface Name
- MAC Address
- IPv4 Address
- IPv6 address
Click on an individual metric (like input or output traffic) under Network to get a graphical representation of the performance data. You can set individual threshold values to the network interfaces for the conditions >, <, =, >=, <= using the pencil icon under Action.
Set thresholds for multiple network interfaces in one go using the Bulk Action button. Click on the Rediscover button to discover network interfaces and add them for monitoring. If you want to have a consolidated report of critical network adapters across servers, check out the network adapter report.
A network interface/adapter will be added for every unique MAC address. If more than one interface has the same MAC address, then only one interface will be added and the rest will be ignored.
Plugins
Customize and monitor data specifically tailored to your needs using Site24x7's plugin integrations. Use our ready-to-install 50+ plugin integrations or write your own plugin using Python or Shell scripts.
| Parameter | Description |
| Plugin Name | Name of the plugin monitor |
| Status | Tells you if the plugin is in the UP or DOWN state |
| Version | This is a mandatory field denoting the version number of the plugin. If the user wants to add/modify/delete attributes, the plugin version needs to be changed to create a new template. Know under what conditions the plugin version needs to be changed |
| Template Name | Name of the plugin template that has the list of attributes to be monitored. Know how to configure a template. |
| Attributes | The total number of attributes listed under that plugin |
| Performance Attribute | While setting up the plugin template, decide which attribute has to be listed in the main Summary page, in the log report and in the main plugin monitors listing page. Learn more |
| Action | You can edit or delete the plugin monitor |
Based on the processes running on your server, the agent will pick up relevant plugins and list it under Recommended Plugins for ease of adding a plugin monitor to your account.
Checks
Monitor internal resources like files, directories, URLs, ports, and syslogs on a Linux server. Click on Create/Edit Resource Check Profile to create/edit resource checks. You can also go to the Admin tab in the Site24x7 web client and click on Server Monitor > Resource Check Profile to add a resource for monitoring. The following internal resources are supported for monitoring:
- File & Directory monitoring
- Access check
- Permissions check
- Size check
- Last modified check (only for files)
- Content check (only for files)
- Subdirectory availability (only for directories)
- File availability (only for directories)
- URL and Port monitoring
- Syslog monitoring
Syslogs
Get ample amount of data laid out in a graphical format detailing downtime, performance drops, and security infringements. Detailed metrics on logging program messages and process severity can be extrapolated from the Syslogs graph.
The user can also check for specific keywords and their occurrences in the syslogs. The logs can be filtered by ID and source to get notified instantly when unexpected behavior occurs.

Tools
Manage various actions and carry out tasks at ease and all in one place using Server Tools. You can also access this page by going to Server > Server Monitor > Server Tools > select your Linux server from the drop-down.
I. Process Viewer
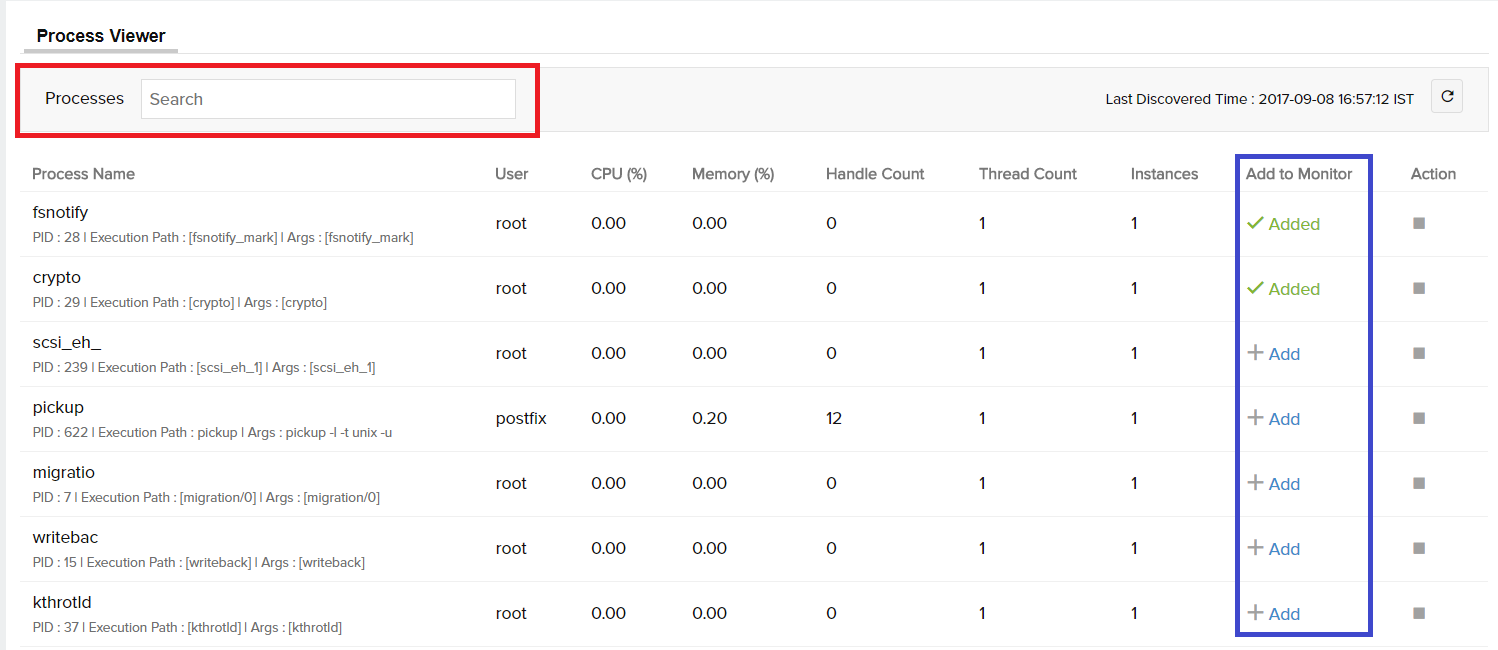
Get the complete list of all the active processes running on your Linux server with their CPU (%) usage, memory (%) usage, handle count, thread count, and instances. You can search for any particular process in the Search Bar at the top (highlighted in red in the screenshot below). You can add processes for monitoring by using the +Add option beside the process name (highlighted in blue in the screenshot below).
Add Custom Tab
Create your own tab and monitor the performance metrics you need.
Steps to add a customized view:
- Click on the Add Custom Tab button.
- Provide a Display Name for identification purposes.
- Select the metrics that you wish to view and monitor under this view.
- Save your changes.
- Click on More > click on the custom dashboard that you created.
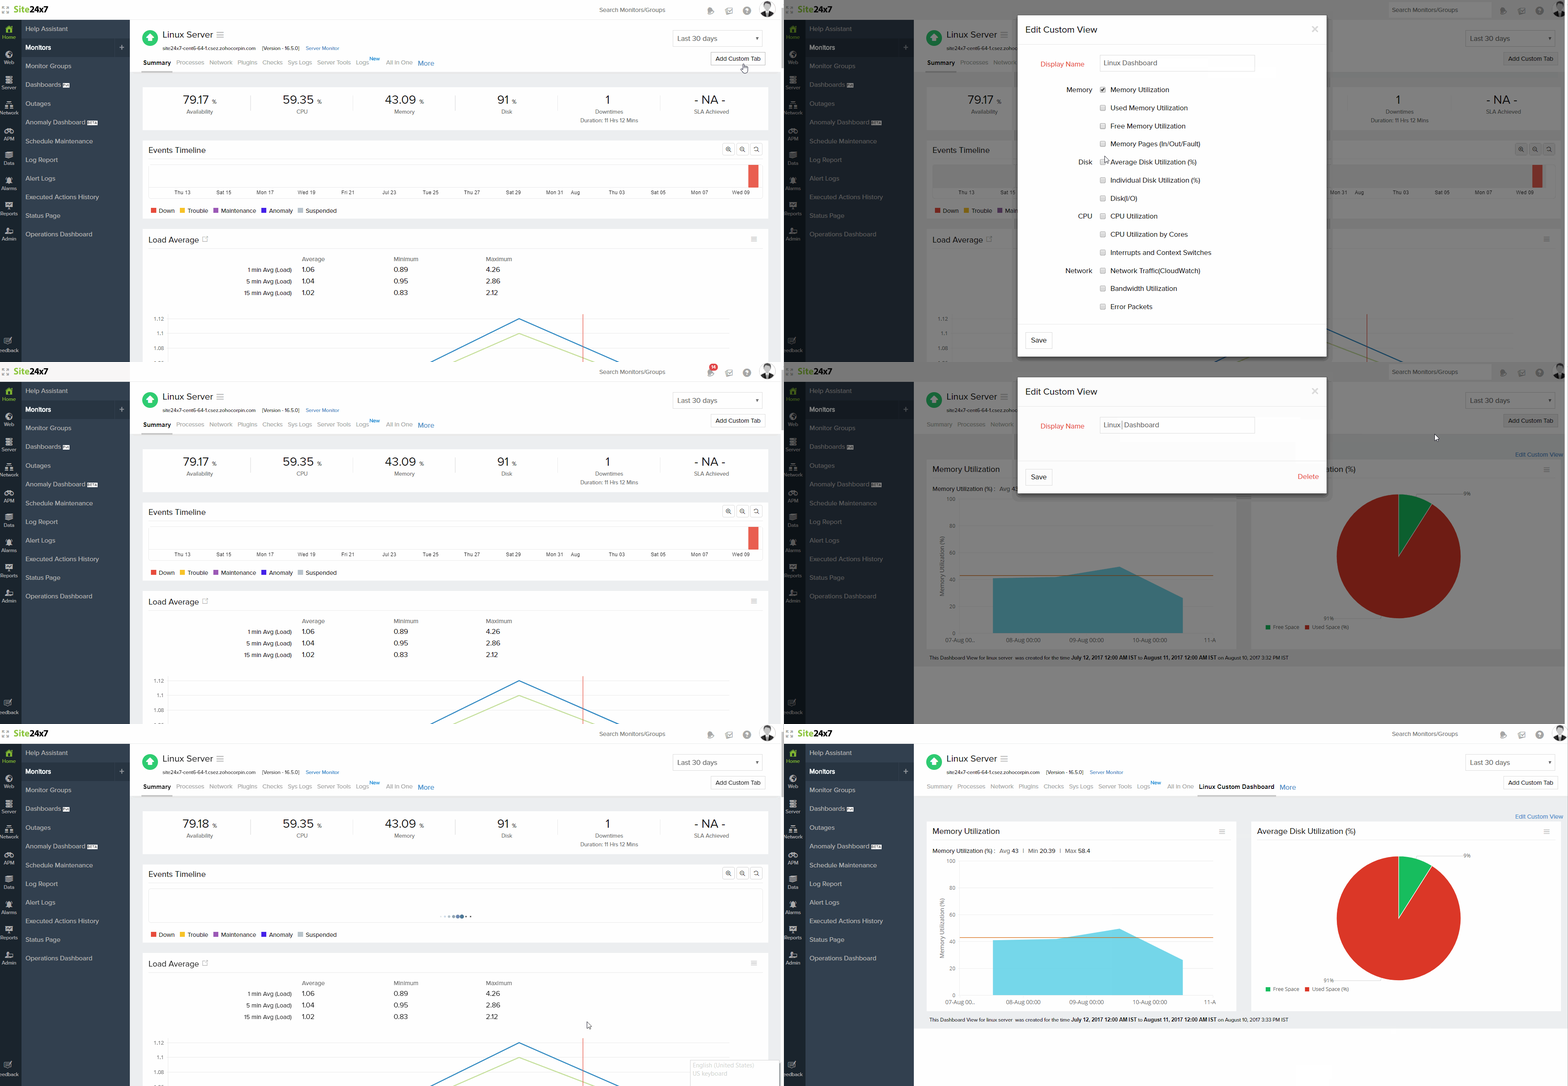
You can edit the display name or delete a custom view by going to Edit Custom View.
Root Cause Analysis (RCA)
Every time a downtime is detected, a Root Cause Analysis (RCA) report is triggered and sent to the user based on the alerting contact and medium. The RCA generated for a Linux server monitor provides the actual reason behind the downtime, along with the trace route map to diagnose connectivity issues.
Performance Reports
Log in to Site24x7 and go to Reports > Server Monitor to access performance reports for Linux monitoring. In addition to the common reports available for all monitor types in Site24x7, server monitoring has some exclusive reports on disk usage, network adapter details, agent inventory, and top n reports for CPU, memory, and disk. Learn more.
Server Inventory & Health Dashboards
Get complete view of your entire server environment with our intuitive dashboards.
- Inventory Dashboard - Displays a count of all your servers, applications, resource checks, plugins and more.
- Health Dashboard - Know the current count and status of all the servers, plugins, and apps in your account.
Licensing
Know what metrics you get for a single Linux server monitor. Learn more.
Related Articles:
- Add a Linux server monitor
- Bulk installation: Chef | Puppet | SaltStack | Ansible | Remote installation using SSH
- Service and process monitoring
- 50+ out-of-the-box plugin integrations
- Server monitoring agent architecture
- Other OS platforms supported: FreeBSD | Windows | OS X
- Troubleshooting Tips
